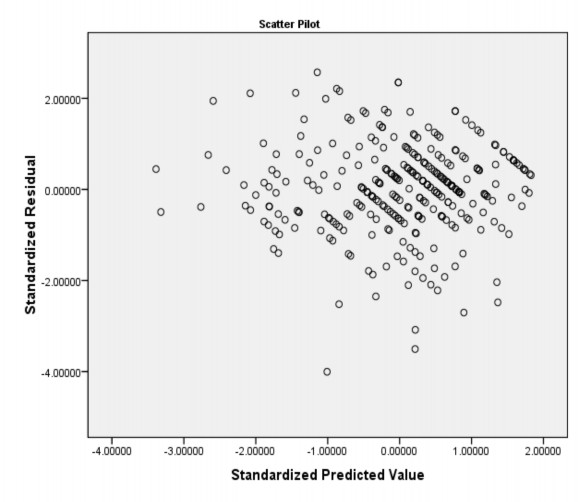
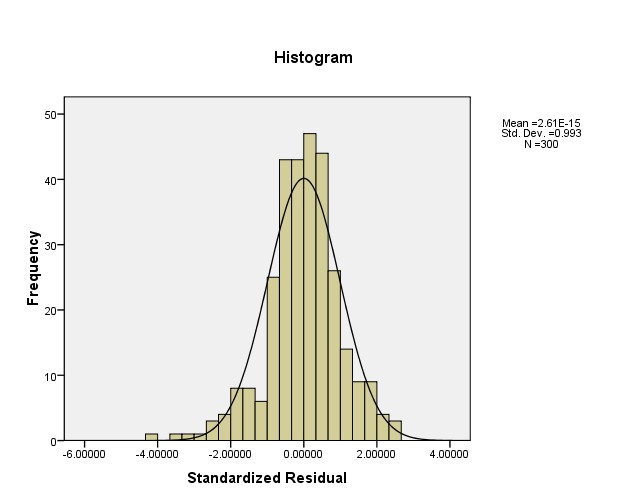
Model Summary
R | R Square | Adjusted R Square | Std. Error of the Estimate | |
1 | .802a | .643 | .638 | .58631 |
Có thể bạn quan tâm!
-
 Hạn Chế Của Đề Tài Và Hướng Nghiên Cứu Tiếp Theo
 -
 Hoàn Toàn Phản Đối Đến 7: Hoàn Toàn Đồng Ý
 -
 Ảnh hưởng của năng lực tâm lý đến kết quả công việc: Nghiên cứu nhân viên ngân hàng và công ty thương mại dịch vụ tại TP.Hồ Chí Minh - 11
 -
 Ảnh hưởng của năng lực tâm lý đến kết quả công việc: Nghiên cứu nhân viên ngân hàng và công ty thương mại dịch vụ tại TP.Hồ Chí Minh - 13
Xem toàn bộ 110 trang tài liệu này.
a. Predictors: (Constant), TN, LQ, HV, TT
ANOVAb
Sum of Squares | df | Mean Square | F | Sig. | ||
1 | Regression | 182.864 | 4 | 45.716 | 132.990 | .000a |
Residual | 101.408 | 295 | .344 | |||
Total | 284.272 | 299 |
a. Predictors: (Constant), TN, LQ, HV, TT
b. Dependent Variable: KQ
Coefficientsa
Unstandardized Coefficients | Standardized Coefficients | t | Sig. | Collinearity Statistics | ||||
B | Std. Error | Beta | Tolerance | VIF | ||||
1 | (Constant) | .419 | .227 | 1.850 | .065 | |||
TT | .365 | .044 | .386 | 8.321 | .000 | .561 | 1.783 | |
LQ | .128 | .040 | .135 | 3.205 | .001 | .684 | 1.463 | |
HV | .237 | .039 | .278 | 6.104 | .000 | .584 | 1.712 | |
TN | .193 | .044 | .192 | 4.400 | .000 | .634 | 1.577 |
a. Dependent Variable: KQ


PHỤ LỤC 7
KẾT QUẢ HỒI QUY THEO LOẠI HÌNH DOANH NGHIỆP
1. Kết quả hồi quy đối với nhân viên ngân hàng
Variables Entered/Removedb
Variables Entered | Variables Removed | Method | |
1 | TNN, LQN, TTN, HVNa | . | Enter |
a. All requested variables entered.
b. Dependent Variable: KQN
Model Summary
R | R Square | Adjusted R Square | Std. Error of the Estimate | |
1 | .795a | .631 | .621 | .57260 |
a. Predictors: (Constant), TNN, LQN, TTN, HVN
Model | Sum of Squares | df | Mean Square | F | Sig. | |
1 | Regression | 81.417 | 4 | 20.354 | 62.081 | .000a |
Residual | 47.541 | 145 | .328 | |||
Total | 128.958 | 149 | ||||
a. Predictors: (Constant), TNN, LQN, TTN, HVN | ||||||
b. Dependent Variable: KQN | ||||||
Coefficientsa
Unstandardized Coefficients | Standardized Coefficients | t | Sig. | |||
B | Std. Error | Beta | ||||
1 (Constant) TTN LQN HVN TNN | .555 | .323 .058 .051 .051 .064 | .402 .180 .220 .206 | 1.717 6.288 3.064 3.370 3.200 | .088 .000 .003 .001 .002 | |
.366 | ||||||
.158 | ||||||
.173 | ||||||
.206 | ||||||
a. Dependent Variable: KQN
2. Kết quả hồi quy đối với nhân viên công ty thương mại- dịch vụ
Variables Entered/Removedb
Variables Entered | Variables Removed | Method | |
1 | TNC, HVC, LQC, TTCa | . | Enter |
a. All requested variables entered.
b. Dependent Variable: KQC
Model Summary
R | R Square | Adjusted R Square | Std. Error of the Estimate | |
1 | .812a | .660 | .651 | .60209 |
a. Predictors: (Constant), TNC, HVC, LQC, TTC
Model | Sum of Squares | df | Mean Square | F | Sig. | |
1 | Regression | 102.095 | 4 | 25.524 | 70.407 | .000a |
Residual | 52.565 | 145 | .363 | |||
Total | 154.660 | 149 | ||||
a. Predictors: (Constant), TNC, HVC, LQC, TTC | ||||||
b. Dependent Variable: KQC | ||||||
Coefficientsa
Unstandardized Coefficients | Standardized Coefficients | t | Sig. | |||
B | Std. Error | Beta | ||||
1 (Constant) TTC LQC HVC TNC | .271 | .322 .068 .065 .060 .061 | .358 .094 .339 .188 | .843 5.124 1.490 5.190 3.119 | .400 .000 .138 .000 .002 | |
.350 .097 .311 .189 | ||||||
a. Dependent Variable: KQC
PHỤ LỤC 8
KIỂM ĐỊNH CÁC THANG ĐO BẰNG CRONBACH’S ALPHA
1. Thang đo Tự tin (TT)
Reliability Statistics
N of Items | |
.879 | 4 |
Item Statistics
Mean | Std. Deviation | N | |
TT1 | 5.41 | 1.186 | 300 |
TT2 | 5.43 | 1.215 | 300 |
TT3 | 5.37 | 1.251 | 300 |
TT4 | 5.83 | 1.160 | 300 |
Item-Total Statistics
Scale Mean if Item Deleted | Scale Variance if Item Deleted | Corrected Item- Total Correlation | Cronbach's Alpha if Item Deleted | |
TT1 | 16.63 | 9.994 | .747 | .842 |
TT2 | 16.61 | 9.811 | .751 | .840 |
TT3 | 16.67 | 9.775 | .724 | .851 |
TT4 | 16.21 | 10.225 | .733 | .847 |
Scale Statistics
Variance | Std. Deviation | N of Items | |
22.04 | 17.005 | 4.124 | 4 |
2. Thang đo Lạc quan (LQ)
Reliability Statistics
N of Items | |
.725 | 3 |
Item Statistics
Mean | Std. Deviation | N | |
LQ1 | 5.13 | 1.345 | 300 |
LQ2 | 5.13 | 1.271 | 300 |
LQ3 | 5.26 | 1.208 | 300 |
Item-Total Statistics
Scale Mean if Item Deleted | Scale Variance if Item Deleted | Corrected Item- Total Correlation | Cronbach's Alpha if Item Deleted | |
LQ1 | 10.39 | 4.714 | .501 | .695 |
LQ2 | 10.40 | 4.367 | .652 | .504 |
LQ3 | 10.26 | 5.250 | .495 | .695 |
Scale Statistics
Variance | Std. Deviation | N of Items | |
15.52 | 9.448 | 3.074 | 3 |


