PHỤ LỤC II: PHÂN TÍCH KẾT QUẢ CRONBACH’S ALPHA
Case Processing Summary
N | % | |
Valid | 150 | 100.0 |
Excluded Cases a | 0 | .0 |
Total | 150 | 100.0 |
Có thể bạn quan tâm!
-
 Kiểm Định Đánh Giá Của Khách Hàng One Sample T-Test
 -
 Kết Quả Kiểm Định One Sample T- Test Của Nhân Tố Về Đáp Ứng Nhu Cầu
 -
 Nghiên cứu sự hài lòng của khách hàng lòng của Học viên về chất lượng dịch vụ tại Trung tâm đào tạo và tư vấn Hồng Đức - 10
 -
 Nghiên cứu sự hài lòng của khách hàng lòng của Học viên về chất lượng dịch vụ tại Trung tâm đào tạo và tư vấn Hồng Đức - 12
 -
 Nghiên cứu sự hài lòng của khách hàng lòng của Học viên về chất lượng dịch vụ tại Trung tâm đào tạo và tư vấn Hồng Đức - 13
Xem toàn bộ 104 trang tài liệu này.

a. Listwise deletion based on all variables in the procedure.
Reliability Statistics
N of Items | |
.777 | 4 |
Item-Total Statistics
Scale Mean if Item Deleted | Scale Variance if Item Deleted | Corrected Item-Total Correlation | Cronbach's Item Deleted | Alpha | if | |
CTĐT1 | 12.13 | 4.876 | .534 | .747 | ||
CTĐT2 | 12.29 | 4.423 | .607 | .710 | ||
CTĐT3 | 12.34 | 4.199 | .620 | .702 | ||
CTĐT4 | 12.50 | 4.386 | .567 | .732 | ||
Case Processing Summary
N | % | ||
Cases | Valid | 150 0 150 | 100.0 .0 100.0 |
Excludeda Total |
a. Listwise deletion based on all variables in the procedure. Reliability
Statistics
N of Items | |
.783 | 5 |
Item-Total Statistics
Scale Mean if Item Deleted | Scale Variance if Item Deleted | Corrected Item- Total Correlation | Cronbach's Alpha if Item Deleted | |
CSVC1 | 14.01 | 9.067 | .555 | .744 |
CSVC2 | 14.05 | 9.541 | .515 | .756 |
CSVC3 | 13.83 | 9.419 | .525 | .753 |
CSVC4 | 14.06 | 9.547 | .550 | .745 |
CSVC5 | 14.27 | 8.506 | .648 | .711 |
Case Processing Summary
N | % | ||
Cases | Valid | 150 0 150 | 100.0 .0 100.0 |
Excludeda Total |
a. Listwise deletion based on all variables in the procedure.
Reliability Statistics
N of Items | |
.838 | 4 |
Item-Total Statistics
Scale Mean if Item Deleted | Scale Variance if Item Deleted | Corrected Item- Total Correlation | Cronbach's Item Deleted | Alpha | if | |
CSHP1 | 12.77 | 4.140 | .717 | .781 | ||
CSHP2 | 12.99 | 4.027 | .667 | .796 | ||
CSHP3 | 12.98 | 3.349 | .743 | .763 | ||
CSHP4 | 13.41 | 4.042 | .581 | .834 | ||
Case Processing Summary
N | % | |
Valid | 150 | 100.0 |
Excluded Cases a | 0 | .0 |
Total | 150 | 100.0 |
a. Listwise deletion based on all variables in the procedure.
Reliability Statistics
N of Items | |
.780 | 5 |
Item-Total Statistics
Scale Mean if Item Deleted | Scale Variance if Item Deleted | Corrected Item-Total Correlation | Cronbach's Alpha if Item Deleted | |
SĐU1 | 16.45 | 7.337 | .590 | .733 |
SĐU2 | 16.85 | 6.502 | .586 | .728 |
SĐU3 | 16.80 | 7.691 | .437 | .774 |
SĐU4 | 17.11 | 6.343 | .548 | .745 |
SĐU5 | 16.81 | 6.412 | .638 | .709 |
Case Processing Summary
N | % | |
Valid | 150 | 100.0 |
Excluded Cases a | 0 | .0 |
Total | 150 | 100.0 |
a. Listwise deletion based on all variables in the procedure.
Reliability Statistics
N of Items | |
.833 | 5 |
Item-Total Statistics
Scale Mean if Item Deleted | Scale Variance if Item Deleted | Corrected Item- Total Correlation | Cronbach's Item Deleted | Alpha | if | |
SHL1 | 17.65 | 4.700 | .586 | .813 | ||
SHL2 | 17.88 | 4.321 | .684 | .785 | ||
SHL3 | 17.88 | 4.388 | .670 | .789 | ||
SHL4 | 17.98 | 4.543 | .610 | .806 | ||
SHL5 | 17.71 | 4.638 | .614 | .805 | ||
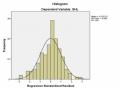
Khóa luận tốt nghiệp GVHD: PGS.TS. Nguyễn Thị Minh Hoà
![]()
1 Giới tính
PHỤ LỤC 3: KẾT QUẢ PHÂN TÍCH ONE SAMPLE T- TEST
Group Statistics
gioitin h | N | Mean | Std. Deviation | Std. Error Mean | |
nam SHL nữ | 36 114 | 4.4500 4.4561 | .58236 .50239 | .09706 .04705 | |
Independent Samples Test
Levene's Equality of | Test for Variances | t-test for Equality of Means | ||||||||
F | Sig. | t | df | Sig. (2- tailed) | Mean Difference | Std. Error Difference | 95% Confidence Interval of the Difference | |||
Lower | Upper | |||||||||
Equal variances assumed | 2.168 | .143 | -.061 | 148 | .951 | -.00614 | .09987 | -.20350 | .19122 | |
SHL | ||||||||||
Equal variances not assumed | -.057 | 52.486 | .955 | -.00614 | .10786 | -.22254 | .21026 | |||
![]()
1. Độ tuổi
ANOVA SHL
PHỤ LỤC IV KẾT QUẢ ONE WAY ANOVA
Sum of Squares | df | Mean Square | F | Sig. | |
Between Groups | .204 | 2 | .102 | .373 | .689 |
Within Groups | 40.188 | 147 | .273 | ||
Total | 40.392 | 149 |
ANOVA
nghenghiep
Sum of Squares | df | Mean Square | F | Sig. | |
Between Groups | 4.392 | 8 | .549 | .372 | .934 |
Within Groups | 208.248 | 141 | 1.477 | ||
Total | 212.640 | 149 |
Test of Homogeneity of Variances
thunhap
df1 | df2 | Sig. | |
1.015 | 8 | 141 | .428 |
ANOVA
thunhap
Sum of Squares | df | Mean Square | F | Sig. | |
Between Groups | 4.885 | 8 | .611 | .752 | .646 |
Within Groups | 114.508 | 141 | .812 | ||
Total | 119.393 | 149 |
Test of Homogeneity of Variances
trinhdohocvan
df1 | df2 | Sig. | |
1.282 | 8 | 141 | .258 |
ANOVA
trinhdohocvan
Sum of Squares | df | Mean Square | F | Sig. | |
Between Groups | 12.607 | 8 | 1.576 | 1.585 | .134 |
Within Groups | 140.226 | 141 | .995 | ||
Total | 152.833 | 149 |
Phụ lục: Kết quả KMO
KMO and Bartlett's Test
Kaiser-Meyer-Olkin Measure of Sampling Adequacy.
Approx. Chi-Square
Bartlett's Test of
df
Sphericity
Sig.
.803
934.929
153
.000