PHỤ LỤC 9
KẾT QUẢ PHÂN TÍCH HỒI QUY
Mode l | Variables Entered | Variables Removed | Method |
1 | MA, RA, CE, CA, ICb | . | Enter |
Có thể bạn quan tâm!
-

 Đánh Giá Tính Hữu Hiệu Của Hệ Thống Kiểm Soát Nội Bộ
 -
 Tính hữu hiệu của hệ thống kiểm soát nội bộ - Nghiên cứu thực nghiệm tại các doanh nghiệp sản xuất gốm sứ tỉnh Bình Dương - 19
 -
 Tính hữu hiệu của hệ thống kiểm soát nội bộ - Nghiên cứu thực nghiệm tại các doanh nghiệp sản xuất gốm sứ tỉnh Bình Dương - 20
 -
 Tính hữu hiệu của hệ thống kiểm soát nội bộ - Nghiên cứu thực nghiệm tại các doanh nghiệp sản xuất gốm sứ tỉnh Bình Dương - 22
Xem toàn bộ 185 trang tài liệu này.
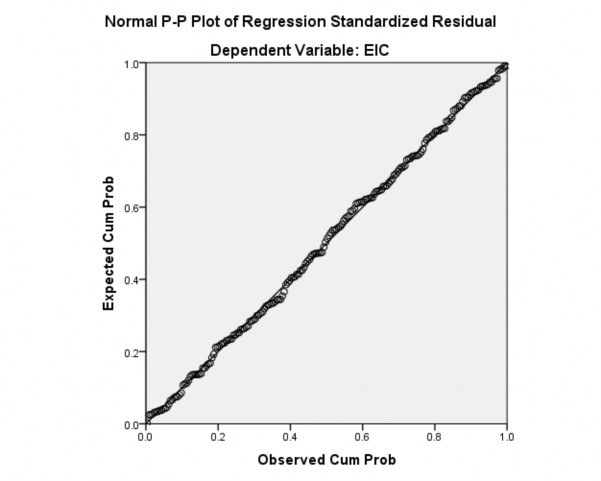
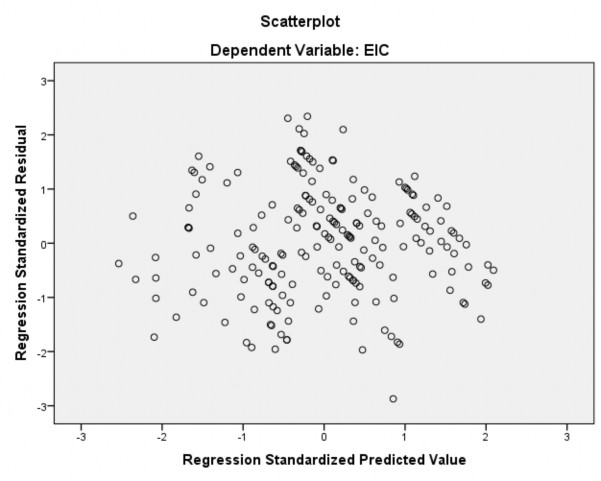
a. Dependent Variable: EIC
b. All requested variables entered.
Mode l | R | R Square | Adjusted R Square | Std. Error of the Estimate | Durbin- Watson |
1 | .817a | .667 | .659 | .44643 | 2.018 |
a. Predictors: (Constant), MA, RA, CE, CA, IC
b. Dependent Variable: EIC
Model | Sum of Squares | df | Mean Square | F | Sig. | |
1 | Regressio n | 77.502 | 5 | 15.500 | 77.774 | .000b |
Residual | 38.664 | 194 | .199 | |||
Total | 116.167 | 199 | ||||
a. Dependent Variable: EIC
b. Predictors: (Constant), MA, RA, CE, CA, IC
Coefficientsa
Unstandardized Coefficients | Standardized Coefficients | t | Sig. | Collinearity Statistics | ||||
B | Std. Error | Beta | Tolerance | VIF | ||||
1 | (Constant) | -.360 | .226 | -1.595 | .112 | |||
CE | .390 | .030 | .535 | 12.857 | .000 | .990 | 1.010 | |
RA | .313 | .030 | .432 | 10.368 | .000 | .988 | 1.012 | |
CA | .249 | .036 | .291 | 6.842 | .000 | .949 | 1.054 | |
IC | .091 | .033 | .121 | 2.785 | .006 | .903 | 1.107 | |
MA | .173 | .031 | .244 | 5.582 | .000 | .895 | 1.117 |
a. Dependent Variable: EIC
Minimum | Maximum | Mean | Std. Deviation | N | |
Predicted Value | 2.1674 | 5.0553 | 3.7500 | .62407 | 200 |
Residual | -1.28238 | 1.04531 | .00000 | .44079 | 200 |
Std. Predicted Value | -2.536 | 2.092 | .000 | 1.000 | 200 |
Std. Residual | -2.873 | 2.341 | .000 | .987 | 200 |
a. Dependent Variable: EIC | |||||

PHỤ LỤC 10
KẾT QUẢ THỐNG KÊ MÔ TẢ
Descriptives Descriptives Statistics
N | Minimum | Maximum | Mean | Std. Deviation | |
CE1 | 200 | 1 | 5 | 3.48 | 1.403 |
CE2 | 200 | 1 | 5 | 3.51 | 1.315 |
CE3 | 200 | 1 | 5 | 3.20 | 1.425 |
CE4 | 200 | 1 | 5 | 3.48 | 1.276 |
CE5 | 200 | 1 | 5 | 3.46 | 1.314 |
CE6 | 200 | 1 | 5 | 3.32 | 1.441 |
CE7 | 200 | 1 | 5 | 3.39 | 1.442 |
Valid N (listwise) | 200 |
Descriptives Statistics
N | Minimum | Maximum | Mean | Std. Deviation | |
RA1 | 200 | 1 | 5 | 3.33 | 1.470 |
RA2 | 200 | 1 | 5 | 3.18 | 1.407 |
RA3 | 200 | 1 | 5 | 3.14 | 1.459 |
RA4 | 200 | 1 | 5 | 3.28 | 1.475 |
RA5 | 200 | 1 | 5 | 3.31 | 1.384 |
Valid N (listwise) | 200 |
Descriptives Statistics
N | Minimum | Maximum | Mean | Std. Deviation | |
CA1 | 200 | 1 | 5 | 3.69 | 1.292 |
CA2 | 200 | 1 | 5 | 3.64 | 1.116 |
CA3 | 200 | 1 | 5 | 3.59 | 1.135 |
CA4 | 200 | 1 | 5 | 3.73 | 1.106 |
CA5 | 200 | 1 | 5 | 3.66 | 1.226 |
Valid N (listwise) | 200 |
Descriptives Statistics
N | Minimum | Maximum | Mean | Std. Deviation | |
IC1 | 200 | 1 | 5 | 3.49 | 1.411 |
IC2 | 200 | 1 | 5 | 3.43 | 1.373 |
IC3 | 200 | 1 | 5 | 3.02 | 1.487 |
IC4 | 200 | 1 | 5 | 3.54 | 1.318 |
IC5 | 200 | 1 | 5 | 3.47 | 1.367 |
Valid N (listwise) | 200 |
Descriptives Statistics
N | Minimum | Maximum | Mean | Std. Deviation | |
MA1 | 200 | 1 | 5 | 3.27 | 1.510 |
MA2 | 200 | 1 | 5 | 2.99 | 1.458 |
MA3 | 200 | 1 | 5 | 3.20 | 1.381 |
MA4 | 200 | 1 | 5 | 3.24 | 1.464 |
MA5 | 200 | 1 | 5 | 3.09 | 1.433 |
Valid N (listwise) | 200 |
