Age
Frequency | Percent | Valid Percent | Cumulative Percent | ||
Valid | 11 | 165 | 93.8 | 93.8 | 93.8 |
12 | 11 | 6.2 | 6.2 | 100.0 | |
Total | 176 | 100.0 | 100.0 |
Có thể bạn quan tâm!
-

 The use of language learning strategies in English reading at Doan Ket secondary school - An investigation - 7
 -
 The use of language learning strategies in English reading at Doan Ket secondary school - An investigation - 8
 -
 The Research Objectives And Research Questions
 -
 The use of language learning strategies in English reading at Doan Ket secondary school - An investigation - 11
 -
 Students’ Learning Strategy Use Synthesized From The Questionnaires
 -
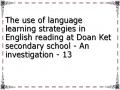 The use of language learning strategies in English reading at Doan Ket secondary school - An investigation - 13
Xem toàn bộ 140 trang tài liệu này.
The 3 steps of data collection were clearly described as the followings:
❖ Questionnaire (see Appendix 3on LLS taken from Oxford 1990, with some adaptations)
The questionnaire of this investigation was curtailed and adapted from Oxford’s (1990) 50-statement model (Version 7.0). The 5-scale questionnaires were adjusted to investigate secondary school students' questions about only reading English (not about other skills). Moreover, the researcher employed the result of questionnaires to measure students’ six LLS use in general and its correlation with students’ learning achievement. The questionnaires were translated into Vietnamese so that students could read the description and tick the statements one by one for their appraisals (see Questionnaire on LLS in Vietnamese). Students only indicated which degree the students had agreed or disagreed to, finally they were going to put every stick on the scale points of statements they decided to choose appropriately. There were total 26 statements in the questionnaire with five scales of frequency for each strategy use:
1 = never or almost never true of me 2 = generally not true of me
3 = somewhat true of me 4 = generally true of me
5 = always or almost always true of me
The researcher collected the mean size coefficients from the total number of samples (N = 176, as a representation of the whole grade 6) being divided into 6 groups of LLS. The result of questionnaires was employed, combined with focus interviews and English course scores to end the analysis of the research database.
❖ Interviews (see Appendix 4on the questions for interviews)
After the results from 5-scale questionnaires, the researcher carried out a group interview to access some student participants by classifying them into two groups of 6-graders (e.g. Good-grade group and Poor-grade group, 3 students of each, chosen convenient samples) and joining the given discussion topic – the questions about their learning strategies.
The interviews (Focus group) were held in a small classroom of Doan Ket Secondary School without exceeding a maximum of an hour. The questions were really based on the questionnaires they had done before, the topic was for why they used that type of language learning strategy, how they used it, and what they felt (see Appendix 5on Focus group interviews in details). They could share the ideas of their language learning with one another in all language skills/ areas they liked best, in their language reading skill the most - a basic foundation skill for English fluency and accuracy. Some short dialogues were recorded and analyzed carefully in Chapter 4. Results and Discussion as a research material afterwards.
❖ Students’ scores in English course (see Appendix 6on the frequency statistics of students’ English marks)
Students’ scores were taken from English learning scores of the course through the total formative assessments (the learning result of the whole year) because secondary school students have not had a specific score for reading
skill or each language skill. School conditions and time did not allow the researcher to test students’ reading skill separately, so it was more convenient to employ these students’ scores in the English course available. The scoring assessment was measured and divided into four groups: Good, Fair, Average, and Poor (according to the regulated criteria of learning assessment). In addition, students’ English scorecards had been done with Statistics Analysis which was equivalent to those classifications: 8.0 marks through highest (Good), 6.5 marks through 7.9 (Fair), 5.0 marks through 6.4 (Average), and Lowest marks through 4.9 (Poor). Students can check looking at their learning achievements through the English mark scores to try their best preparing for the next school year when they are going up to Class 7 (see Table 3. 2.).
Table 3.2. Statistics of students’ scores in English course
Frequency | Percent | Valid Percent | Cumulative Percent | ||
Valid | 8.0 marks through highest | 68 | 38.6 | 38.6 | 38.6 |
6.5 marks through 7.9 | 55 | 31.2 | 31.2 | 69.9 | |
5.0 marks through 6.4 | 51 | 29.0 | 29.0 | 98.9 | |
Lowest marks through 4.9 | 2 | 1.1 | 1.1 | 100.0 | |
Total | 176 | 100.0 | 100.0 |
Consequently, the researcher compared every student participant’s scores in English course with the total score mean from the questionnaire to detect if a student has used which language learning strategies most or least. Finally, teachers can train or consult students with the best English language learning strategies soon.
3.6. Data analysis
Firstly, the researcher tested the trustworthiness of this study because it is crucial to evaluating its merit (Lincoln & Guba, 1985). It is needful to establish the trustworthiness because: truly enhancing the confidence in the findings (i.e.
credibility), showing the consistency of findings as well as its replication efficiency (i.e. dependability), clarifying what extent the respondents shaped the findings to a study without researcher biases (i.e. confirmability), and showing that other contexts can apply the findings of this study (i.e. transferability).
The subsections like credibility, dependability, confirmability and transferability will discuss the procedures to retain the trustworthiness of the study.
3.6.1. Credibility
The researcher has used a number of procedures to enhance its credibility. This study also heightens the credibility of quantitative research in nature (e.g. the frequently used LLS by DK students). The accurate use of research findings requires an optimist result. By making the questionnaire statistics for independent and dependent variables, factor analysis (EFA) and running regression, this study has had a database for dependent and independent variables. It is necessary for qualitative researchers to demonstrate the credibility of the research (Creswell & Miller, 2000); therefore, another part of this study using qualitative research also needs credibility by correlation analysis (e.g. the correlation between students’ frequency of LLS use and their performance in English achievement).
This study was implemented through the different instruments for questionnaires such as observation, interviews, video-recordings and research journals in which gave the various perspectives about the language learning strategies use of Doan Ket students. Ending the observation and interviews, the researcher can describe a complete synthesis of Doan Ket Secondary School students’ existing situations.
3.6.2. Dependability
Dependability is an important milestone to emphasize the researcher’s database, to which degree an interpretation of research procedure is made – the degree to which it is able to solve the problems of instability or particularity (Baxter & Eyles, 1997). It implies that if the research approaches/ procedures are applied by others in similar research or yielded similar findings (Given & Saumure, 2008).
Correspondingly, this study mixed the two research approaches into one general picture of DK Secondary School students. Based on the basis of real research materials, the results from this study are dependable and they may be reused for the updated news of secondary education in District 6 (if necessary).
3.6.3. Confirmability
Jensen’s (2008a) confirmability here means the researcher’s results are based on its objective purpose, not on the researcher’s bias. Confirmability required a consideration of the critical self-reflection (Patton, 2002) by carrying out this research under the forms of data collection, interpretation, and analysis. Baxter & Eyles (1997) declared that confirmability concentrates on both the investigator and the interpretations.
The teaching experiences at secondary schools, the motivations in English teaching and learning, English books training, the practical conjunctures and the perceptions of English language use in secondary schools in Vietnam might have affected the data interpretation of this study, so the researcher made some perspectives rather explicit contributing to the truthfulness of this research.
3.6.4. Transferability
According to Jensen (2008, p.887), transferability implies that a qualitative study’s results “can be transferred to other contexts and situations beyond the scope of the study context”. To enhance transferability, he proposed
paying much attention to the relationship between the study context and the contextual boundaries of the findings. Therefore, the extent to qualitative research describes the context that readers can decide whether the study’s results can be transferred to that context. Transferability impulses a comprehensive description of the study context, and the research data was analyzed under the main instrument of data collection – SILL (questionnaires).
3.6.5. Analysis of research data
The data was analyzed according to Oxford’s (1990) definitions and classification on language learning strategies, the research method here was the qualitative research employing the theories and previous studies from the linguists over the world and the five-point Likert Scale questionnaires with the 26 statements inside to answer the first research question about the frequency of LLS use at DK school. As mentioned in the aforementioned parts, the use of questionnaires helped the researcher identify which types of LLS the students at Doan Ket Secondary School have used and how often they used those LLS. The researcher then used 176 convenient samplings available and collected their answers from the questionnaires handed out (e.g. N = 176, including 89 boys and 87 girls, nearly a whole grade 6). The 26-statement questionnaires (translated in Vietnamese version) which were classified into only six groups of language learning strategies (according to Oxford’s definitions on LLS):
1) Memory strategies (e.g. statements 2, 4, 5, 11)
2) Cognitive strategies (e.g. statements 3, 7, 14, 24)
3) Compensation strategies (e.g. statements 6, 9, 10, 15, 16)
4) Metacognitive strategies (e.g. statements 13,18, 19, 22, 23)
5) Affective strategies (e.g. statements 1, 17, 20, 21, 26) and
6) Social strategies (e.g. statements 8, 12, 25)
Next, the researcher took account of the mean coefficient of each student upon every questionnaire in turns. Mean sizes decide whether the students have used more or less LLS via the indicators to understand high, medium, or low mean coefficients (see Figure 2.5). For example, if a student’s mean effect equals 4, that student uses many LLS (at high level), and vice versa, if a student’s mean equals 1.5 (at low level) signifies this person does less language learning strategies, and the rest middle mean shows an average level. After computing the total mean coefficient of each questionnaire, it could be continuous with the mean of all questionnaires from the surveyed students. Later on, this mean indicator was compared to students’ scores in English courses per student.
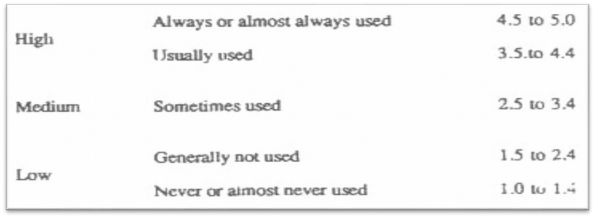
Figure 2.5. Key to understand the averages - SILL profile of results, Version 7.0 (Oxford 1990, p.300)
3.6.6. Language strategy use inventory
CRONBACH’S ALPHA RELIABILITY TEST
Cronbach's Alpha shows that all the values of the Learning Strategy Use are proved to be internally consistent and be accepted to join in the factor analysis tests because they satisfy the three requirements proposed by the Cronbach’s alpha reliability test as the followings: Firstly, α is 0.907 (excellent) which is higher than the acceptable value 0.6 (Nunnally & Bernstein, 1994).
Secondly, all Corrected Item-Total Correlation values are higher than the standard of 0.3 (Nunnally, 1978). Finally, it is worth noticing that all Cronbach's Alpha if Item Deleted of 6 items do not exceed more than the α of 0.907 (see Tables 3.3. & 3.4. for Cronbach's Alpha)
Table 3.3. Reliability statistics
N of Items | |
.907 | 6 |
Table 3.4. Cronbach’s alpha reliability test of LLS use
Scale Mean if Item Deleted | Scale Variance if Item Deleted | Corrected Item- Total Correlation | Cronbach's Alpha if Item Deleted | |
Memory Strategy | 16.6791 | 13.243 | .655 | .902 |
Cognitive Strategy | 16.7117 | 12.219 | .758 | .888 |
Compensation Strategy | 16.8870 | 12.543 | .747 | .890 |
Metacognitive Strategy | 16.7188 | 11.895 | .823 | .878 |
Affective Strategy | 16.9052 | 12.277 | .777 | .885 |
Social Strategy | 17.1355 | 12.256 | .700 | .897 |
Table 3.4. above was the scales for testing Cronbach’s Alpha Reliability of LLS use with Scale Mean if Item Deleted, Scale Variance if Item Deleted, Corrected Item-Total Correlation, and Cronbach's Alpha if Item Deleted.
FACTOR ANALYSIS TEST
Factor analysis is a method of data reduction in which the underlying unobservable variables are observed and reflected if there are enough adaptable conditions for a Correlation Analysis for these LLS. Results from the below tables have indicated that all factors in findings are necessary to be explained