CHAPTER 4. RESULTS AND DISCUSSION
4.1. Results
4.1.1. Students’ learning strategy use synthesized from the questionnaires
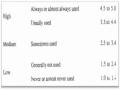
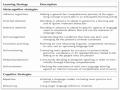
Students’ use of learning strategies was synthesized from the questionnaires. The use of learning strategies by DK Secondary School students were measured via the five-point Likert Scale together with other tools on the SPSS 16.0 Software. This scale included the five levels (from 1 to 5) equivalent to the components enclosed as stated in the research analysis (Item 3.2). The questionnaire based on Oxford’s definitions with the 26 disordered statements classified into six groups of learning strategies: Memory strategies, Cognitive strategies, Compensation strategies, Metacognitive strategies, Affective strategies, and Social strategies. Furthermore, the questionnaire was also curtailed and applied according to the three levels of using learning strategies from Oxford (1990): 3.5 – 5.0 (high); 2.5 – 3.4 (average); 1.0 – 2.4 (low). After testing Frequency and Descriptive Statistics, the total group mean of learning strategies has M≈3.4 and SD≈0.7 and it concludes that the sixth graders of Doan Ket School have used language learning strategies at a medium level.
This 26-item questionnaire was checked on the SPSS 16.0 Software for its Statistics description. Before certifying the questionnaire information, the check-up activities with no missing data are implemented to be sure of that database (see Table 4.1.). The 176 participants (included 89 boys and 87 girls) spread the point scales from 1 to 5 (e.g. 1 for minimum, and 5 for maximum) equivalent to the components enclosed (from Strategy-C1 to Strategy-C26). These high mean coefficients (M>=2.63) indicate that most participants agree with the content of questionnaires, hence 100% of this database is valid. In addition, all Standard Deviations of the questionnaires are always at high level
(SD>1) means that the feedback from participants are multiform and various at the different stages of LLS, and that Standard Deviations usually fluctuate around the mean coefficients.
Table 4.1. Descriptive statistics of questionnaires
N | Minimum | Maximum | Mean | Std. Deviation | |
C1 | 176 | 1 | 5 | 3.52 | 1.146 |
C2 | 176 | 1 | 5 | 3.86 | 1.099 |
C3 | 176 | 1 | 5 | 3.43 | 1.139 |
C4 | 176 | 1 | 5 | 3.61 | 1.195 |
C5 | 176 | 1 | 5 | 3.34 | 1.273 |
C6 | 176 | 1 | 5 | 3.09 | 1.255 |
C7 | 176 | 1 | 5 | 3.68 | 1.038 |
C8 | 176 | 1 | 5 | 3.16 | 1.210 |
C9 | 176 | 1 | 5 | 3.53 | 1.176 |
C10 | 176 | 1 | 5 | 3.67 | 1.154 |
C11 | 176 | 1 | 5 | 3.31 | 1.277 |
C12 | 176 | 1 | 5 | 2.84 | 1.288 |
C13 | 176 | 1 | 5 | 3.07 | 1.251 |
C14 | 176 | 1 | 5 | 3.44 | 1.189 |
C15 | 176 | 1 | 5 | 3.59 | 1.173 |
C16 | 176 | 1 | 5 | 2.73 | 1.349 |
C17 | 176 | 1 | 5 | 3.73 | 1.124 |
C18 | 176 | 1 | 5 | 3.74 | 1.141 |
C19 | 176 | 1 | 5 | 3.49 | 1.166 |
C20 | 176 | 1 | 5 | 3.30 | 1.359 |
C21 | 176 | 1 | 5 | 2.63 | 1.452 |
C22 | 176 | 1 | 5 | 3.73 | 1.226 |
C23 | 176 | 1 | 5 | 3.41 | 1.192 |
C24 | 176 | 1 | 5 | 3.44 | 1.254 |
C25 | 176 | 1 | 5 | 3.22 | 1.223 |
C26 | 176 | 1 | 5 | 3.34 | 1.272 |
Valid N (listwise) | 176 |
Có thể bạn quan tâm!
-
 The Research Objectives And Research Questions
 -
 The use of language learning strategies in English reading at Doan Ket secondary school - An investigation - 10
 -
 The use of language learning strategies in English reading at Doan Ket secondary school - An investigation - 11
 -
 The use of language learning strategies in English reading at Doan Ket secondary school - An investigation - 13
 -
 The use of language learning strategies in English reading at Doan Ket secondary school - An investigation - 14
 -
 The use of language learning strategies in English reading at Doan Ket secondary school - An investigation - 15
Xem toàn bộ 140 trang tài liệu này.
This study employed correlational research design to identify the relationship between variables in which Cronbach’s Alpha, Factor Analysis Test, and Multiple Regression Analysis were also tested for this study. There were six independent variables - strategies of language learning strategies by Oxford (1990) (as predictors) and one dependent variable - English proficiency (as criterion). From the LLS-English proficiency correlation, it was referred to the related factors of the learning outcomes of DK students such as students’ LLS use, especially the choice and use of reading strategies changing these students’ learning awareness themselves.
![]() The most frequently used learning strategies and the least frequently used:
The most frequently used learning strategies and the least frequently used:
Besides the total mean by the descriptive statistics command, the mean indicators in each group of learning strategies are at different levels (E.g. Mean effect sizes is from 3.0 to higher than 3.0 up) and as an evidence to affirm the sixth-graders did use the language learning strategies casually but in a following sequence: Memory Strategy, Cognitive Strategy, Metacognitive Strategy, Compensation Strategy, Affective Strategy, and Social Strategy (see Table 4.2.).
Table 4.2. Descriptive statistics of the frequency of LLS use
N | Minimum | Maximum | Mean | Std. Deviation | |
Memory Strategy | 176 | 1.00 | 5.00 | 3.5284 | .77499 |
Cognitive Strategy | 176 | 1.00 | 5.00 | 3.4957 | .86292 |
Metacognitive Strategy | 176 | 1.00 | 5.00 | 3.4886 | .86288 |
Compensation Strategy | 176 | 1.00 | 5.00 | 3.3205 | .81754 |
Affective Strategy | 176 | 1.00 | 5.00 | 3.3023 | .83768 |
Social Strategy | 176 | 1.00 | 5.00 | 3.0720 | .90844 |
Valid N (listwise) | 176 |
Thus, it proclaimed their most frequently used learning strategy was the memory strategy with M≈3.53 and SD=0.77 through the strategy “I read and write new English words every day to remember them easily” (M=3.86 and SD≈1.1) (Sentence 2) and “I remember a new English word by reading and writing in papers many times” (M=3.6 and SD≈1.2) (Sentence 4). Next, Cognitive Strategy had M≈3.5 and SD=0.86 with the strategy “I often review my English lessons” (M=3.68 and SD=1) (Sentence 7). In contrast, their least used learning strategy was Social Strategy with M=3.0 and SD=0.9; for example, the strategy “I sometimes read English stories with my classmates in class” had the lowest frequency in Social Strategy (M=2.8 and SD=1.2) (Sentence 12). The next one was “I write down my feelings in a personal diary after reading a text.” (M=2.6 and SD=1.4) (Sentence 21) in Affective strategy.
4.1.2. Results from focus interviews
As stated in the research procedure, the interviews were carried out in two groups of interviews (e.g. Good-grade group and Poor-grade group, 3 students of each, chosen convenient samples) participating in the given discussion topic- the questions about their learning strategies. After that, the questioning interviews of LLS were found to reaffirm the reasons for choosing and using any type of language learning strategies, how they used it, and what they felt. They shared the ideas of their language learning as followings:
The good-grade group said, “We like reading and speaking a lot, because these are the two main elements of all language skills. We all know that learning a language needs to grasp as much vocabulary as possible, and reading comprehension will be a tool of our English learning. We read a lot to have a large source of vocabulary knowledge, then employ vocabulary to speak English well (i.e. reading comic books, English books, or reference books, etc.). We read and
write vocabulary at every English lesson, then utilize these new words for our exercise accomplishment. Sometimes, we practice English with our friends - partners. For these things, we think we become good students in our class and feel happy”. That showed the good learning styles and the confidence in English of these students.
At the same point, the students in the poor-grade group admitted the role of vocabulary for reading comprehension, however, their learning results were not very good because of their lack of basic English knowledge leading to other problems in learning English. They explained, “This is due to our “laziness” leading to our lower proficiency in English. Though we are not good students, we like listening and speaking English to foreigners so that we can improve our English language ability (For instance, we sometimes go to the Ho Chi Minh city center to meet and communicate with some foreigners)”. That showed a change inside these students’ personality and learning attitude – a more active way of English learning for next school year.
Hence, both two groups certified an important thing: English language proficiency has been made by learning and practicing English every day. The basic problem was how they learned a language and in case of difficulties, who would help them - a teacher or themselves that was associated with LLS use, especially reading strategies in which English reading skills were done as a basic foundation for reaching English fluency and accuracy.
4.1.3. Results from the comparison between total mean coefficient and students’ scores in English course
Right after the reliability test, the researcher found the regression running could not help explain the correlation between the learning strategies and students’ English marks clearly, thus a replacement by the comparison between
total mean coefficient of LLS and students’ English scorecards was more appropriate. Table 4.3. indicated the Mean total of LLS M=3.36 (calculated from the mean coefficients of six LLS), taking this mean coefficient to compare with students’ English marks in the course to detect any correlation in students’ English performance.
Table 4.3. Descriptive statistics - Mean total of LLS
N | Minimum | Maximum | Mean | Std. Deviation | |
Mean Total | 176 | 1.00 | 5.00 | 3.3679 | .69795 |
Valid N (listwise) | 176 |
Continuously, when making a partially statistical analysis from students’ English scores (different groups of proficiency), it is found that there have been 68 good-grade students of the total 176 (occupies 38.6 %), 55 fair students of the total 176 (occupies 31.2 %), 51 average students of the total 176 (occupies 29 %) and 2 poor-grade ones of the total 176 (occupies 1.1 %). The 3.5 is for the lowest point in English and 10.0 is for the highest one (see Table 4.4.).
Table 4.4. English marks - Statistics
Valid | 176 | |
Missing | 0 | |
Mean | 7.386 | |
Std. Deviation | 1.4673 | |
Minimum | 3.5 | |
Maximum | 10.0 | |
Table 4.5. revealed the reciprocal relationship between the Mean Total of LLS and students’ English scorecards when making a comparison of them (comparison for good students only). The analysis represented that Reading Language Strategy alone was not completely affected by the results of lower secondary school students (i.e. semester school reports). To get good points, students must set up their learning objectives clearly (which language learning
strategies are highly appreciated). Good students always get high scores in their language learning while poor-grade students often confuse it with English language performance as well as with the assessment forms from teachers.
Table 4.5. Report of the comparison between mean total and English marks (for good students only)
Mean Total
Mean | N | Std. Deviation | |
8 | 3.5229 | 4 | 1.22347 |
8.1 | 3.2056 | 2 | .09821 |
8.2 | 2.8951 | 4 | .56877 |
8.3 | 3.4383 | 5 | .73664 |
8.4 | 3.6326 | 8 | .61718 |
8.5 | 4.0852 | 3 | .84233 |
8.6 | 4.4250 | 2 | .16892 |
8.7 | 2.6611 | 3 | 1.43953 |
8.8 | 3.2176 | 3 | .63119 |
8.9 | 3.7102 | 3 | .59406 |
9 | 3.5537 | 3 | .06974 |
9.1 | 3.5500 | 4 | .56400 |
9.2 | 3.5315 | 3 | .81150 |
9.3 | 3.4315 | 3 | .50579 |
9.4 | 2.5764 | 2 | .14339 |
9.5 | 4.1417 | 2 | 1.21387 |
9.6 | 3.7630 | 9 | .67481 |
9.7 | 3.5667 | 1 | . |
9.8 | 3.9028 | 1 | . |
9.9 | 3.1806 | 1 | . |
10 | 3.6042 | 2 | .50480 |
Total | 3.5165 | 68 | .73370 |
An interesting finding here is that the majority of good students have utilized Metacognitive strategies at the highest level so far, followed by Cognitive strategies, and Memory strategies that proclaims these students’ high proficiency of English. Conversely, poor-grade students use less language learning strategies, Memory Strategy and Cognitive Strategy are their two least used strategies, even the rote learning is something difficult to these students. Being related to students’ cognition, whether they have any – It depends. However, those students’ cognitive manifestation is dominated by their negligent or unwilling learning style. In the learning process, they also used Metacognitive strategies but not much that they were controlled by Affective strategies and Compensation strategies. For this reason, poor-grade students have lower proficiency in English than the good-grade. It means that cognition determines the true value of a learner, and this depends on what a student’s leaning awareness is. Therefore, good students can become more excellent under the various forms of LLS setting, planning and management at school.
4.2. Discussion of results
The sequence of the first research question shows that the sixth graders of Doan Ket Secondary School have used language learning strategies with a medium rate, in which the memory strategy and cognitive strategy were most frequently used. This study partly coincides with Cong-Lem’s research (2019) about the identification of six language learning strategies (LLS), but there are some differences among student participants (e.g. his tenth grader participants were of the levels of frequency as well as the most or least frequently used strategies). Simultaneously, it insists on the effects of LLS instruction (Suwanarak, 2019). The result of this study presents a dispensable for LLS instruction, particularly reading strategies instruction to low secondary school