Model Summaryb
R | R Square | Adjusted R Square | Std. Error of the Estimate | Durbin- Watson | |
1 | .881a | .776 | .769 | .39767 | 1.674 |
Có thể bạn quan tâm!
-

 Nhóm Phát Biểu Cho Thành Phần Phương Tiện Hữu Hình Được Kế Thừa Thang Đo Của Cronin Và Taylor (1992)
 -
 Số Năm Công Ty Sử Dụng Dịch Vụ Tại Cục Hải Quan Tỉnh Cà Mau:
 -
 Sự hài lòng của doanh nghiệp xuất, nhập khẩu đối với chất lượng dịch vụ hải quan tại Cục Hải quan tỉnh Cà Mau - 15
Xem toàn bộ 130 trang tài liệu này.
a. Predictors: (Constant), DU, NLPV, DTC, DC, PTHH
b. Dependent Variable: SHL
ANOVAa
Sum of Squares | df | Mean Square | F | Sig. | ||
Regression | 89.418 | 5 | 17.884 | 113.085 | .000b | |
Residual | 25.777 | 163 | .158 | |||
Total | 115.195 | 168 |
a. Dependent Variable: SHL
b. Predictors: (Constant), DU, NLPV, DTC, DC, PTHH
Coefficientsa
Unstandardized Coefficients | Standardized Coefficients | t | Sig. | Collinearity Statistics | ||||
B | Std. Error | Beta | Toleranc e | VIF | ||||
1 | (Constant) | -1.078 | .243 | -4.444 | .000 | |||
DTC | .103 | .041 | .104 | 2.505 | .013 | .796 | 1.256 | |
DC | .392 | .045 | .352 | 8.632 | .000 | .825 | 1.213 | |
PTHH | .107 | .049 | .092 | 2.195 | .030 | .788 | 1.270 | |
NLPV | .550 | .037 | .589 | 14.726 | .000 | .859 | 1.164 | |
DU | .150 | .044 | .142 | 3.415 | .001 | .800 | 1.250 |
a. Dependent Variable: SHL
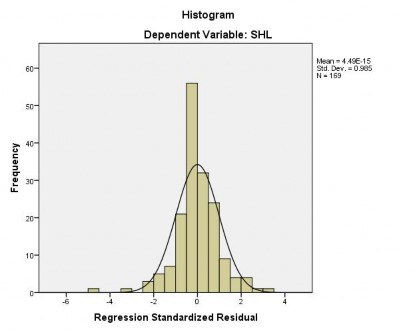
Biểu đồ Histogram
-2
2
O
O O
O
O *OO O’ O
0
O”
O O O
8
8
o
o
O
Reg ress1•u Stan6 ark1ze6 Res16nat
Scatterplot Dependent Variable: SHL
Regression Standardized Predicted Value
Phụ lục 7.7: Kiểm tra sự khác biệt
* Loại hình DN
Descriptives
SHL
N | Mean | Std. Deviatio n | Std. Error | 95% Confidence Interval for Mean | Minimum | Maximum | ||
Lower Bound | Upper Bound | |||||||
CO PHAN | 96 | 3.9468 | .66179 | .06754 | 3.8127 | 4.0809 | 1.36 | 4.96 |
TNHH | 56 | 3.8546 | .77710 | .10384 | 3.6465 | 4.0627 | 1.82 | 5.00 |
LOAI KHAC | 17 | 3.2542 | 1.44571 | .35064 | 2.5109 | 3.9975 | 1.36 | 4.96 |
Total | 169 | 3.8466 | .82806 | .06370 | 3.7208 | 3.9723 | 1.36 | 5.00 |
Test of Homogeneity of Variances SHL
df1 | df2 | Sig. | |
23.739 | 2 | 166 | .000 |
ANOVA
SHL
Sum of Squares | df | Mean Square | F | Sig. | |
Between Groups | 6.933 | 2 | 3.467 | 5.316 | .006 |
Within Groups | 108.262 | 166 | .652 | ||
Total | 115.195 | 168 |
Robust Tests of Equality of Means
SHL
Statistica | df1 | df2 | Sig. | |
Welch | 1.996 | 2 | 38.324 | .150 |
a. Asymptotically F distributed.
N | Mean | Std. Deviatio n | Std. Error | 95% Confidence Interval for Mean | Mini mum | Maxi mum | ||
Lower Bound | Upper Bound | |||||||
DUOI 1 NAM | 18 | 3.1448 | 1.08614 | .25600 | 2.6047 | 3.6850 | 1.36 | 4.64 |
TU 1 NAM DEN DUOI 5 NAM | 56 | 4.0772 | .56546 | .07556 | 3.9257 | 4.2286 | 2.39 | 5.00 |
TU 5 NAM TRO LEN | 95 | 3.8436 | .83610 | .08578 | 3.6733 | 4.0139 | 1.57 | 4.96 |
Total | 169 | 3.8466 | .82806 | .06370 | 3.7208 | 3.9723 | 1.36 | 5.00 |
* Số năm sử dụngSHL
Descriptives
Test of Homogeneity of Variances
SHL
df1 | df2 | Sig. | |
9.259 | 2 | 166 | .000 |
ANOVA
SHL
Sum of Squares | df | Mean Square | F | Sig. | |
Between Groups | 11.842 | 2 | 5.921 | 9.510 | .000 |
Within Groups | 103.353 | 166 | .623 | ||
Total | 115.195 | 168 |
Robust Tests of Equality of Means SHL
Statistica | df1 | df2 | Sig. | |
Welch | 6.994 | 2 | 43.734 | .002 |
a. Asymptotically F distributed.
Phụ lục 7.8: Tính trung bình
Descriptive Statistics
N | Minimum | Maximum | Mean | Std. Deviation | |
PTHH1 | 169 | 1 | 5 | 4.09 | .826 |
PTHH2 | 169 | 1 | 5 | 4.04 | .743 |
PTHH3 | 169 | 1 | 5 | 3.67 | .890 |
PTHH4 | 169 | 1 | 5 | 3.98 | .841 |
PTHH | 169 | 1 | 5 | 3.95 | .707 |
Valid N (listwise) | 169 |
Descriptive Statistics
N | Minimum | Maximum | Mean | Std. Deviation | |
DTC1 | 169 | 1 | 5 | 3.85 | 1.102 |
DTC2 | 169 | 1 | 5 | 3.88 | 1.048 |
DTC3 | 169 | 1 | 5 | 3.79 | .999 |
DTC4 | 169 | 1 | 5 | 3.73 | 1.009 |
DTC5 | 169 | 1 | 5 | 3.80 | .949 |
DTC | 169 | 1 | 5 | 3.81 | .834 |
Valid N (listwise) | 169 |
Descriptive Statistics
N | Minimum | Maximum | Mean | Std. Deviation | |
DU1 | 169 | 1 | 5 | 3.69 | .867 |
DU2 | 169 | 1 | 5 | 3.36 | .953 |
DU3 | 169 | 1 | 5 | 3.18 | 1.050 |
DU4 | 169 | 1 | 5 | 3.33 | .956 |
DU | 169 | 1 | 5 | 3.39 | .782 |
Valid N (listwise) | 169 |
Descriptive Statistics
N | Minimum | Maximum | Mean | Std. Deviation | |
NLPV1 | 169 | 1 | 5 | 3.94 | 1.138 |
NLPV2 | 169 | 1 | 5 | 3.86 | 1.134 |
NLPV3 | 169 | 1 | 5 | 3.83 | .945 |
NLPV4 | 169 | 1 | 5 | 3.69 | 1.012 |
NLPV | 169 | 1 | 5 | 3.83 | .886 |
Valid N (listwise) | 169 |
Descriptive Statistics
N | Minimum | Maximum | Mean | Std. Deviation | |
DC1 | 169 | 1 | 5 | 3.79 | .957 |
DC2 | 169 | 1 | 5 | 3.83 | .857 |
DC3 | 169 | 1 | 5 | 3.82 | .911 |
DC4 | 169 | 1 | 5 | 3.78 | 1.010 |
DC5 | 169 | 1 | 5 | 3.83 | 1.039 |
DC | 169 | 1 | 5 | 3.81 | .745 |
Valid N (listwise) | 169 |
Descriptive Statistics
N | Minimum | Maximum | Mean | Std. Deviation | |
SHL1 | 169 | 1 | 5 | 4.08 | .970 |
SHL2 | 169 | 1 | 5 | 3.82 | 1.054 |
SHL3 | 169 | 1 | 5 | 3.73 | 1.110 |
SHL4 | 169 | 1 | 5 | 3.75 | .805 |
SHL | 169 | 1 | 5 | 3.85 | .828 |
Valid N (listwise) | 169 |