TOURIST’S QUESTIONAIRE
Dear Sir or Madam.
I am Nguyen Phu Thang, a student of PhD Geography program in HCM University of Education. I am conducting the thesis with topic “Angiang Tourism Development with the neighbouring region in Mekong Delta”.
Concerned about continuous development of tourism sector in Angiang province, the questionaire are created, in order to receive your feedbacks of tourist’s destinations in Angiang province. We would be grateful if you would fill in this questionare. We so much apreciate of your answers as genuinely and spontaneously as posible. This will only take about 5 minutes of your time. The declared information is only used for evaluation purposes; all details of this information will be strictly no disclosure.
PART I. INFORMATION OF YOUR TRIP
1. How many times you have been in Angiang?
1. One 3. Three times
2. Twice 4. More
2. Which sources of information of your trip you approached (mark the appropriate answer, more answers possible)?
1. Friends, relatives 4. Tivi, radio
2. Internet 5. Tourist company
3. Newspaper, magazine 6.Other s (details)
3. What is your main purpose for this trip?
1. Rest and relaxation 5. Business
2. Visiting relatives or friends 6. Attending conference, workshop
3. Religious purpose 7. Health
4. Official declare 8.Other s (details)
4. Which services and products do you prefer in this trip? (mark the appropriate answer, more answers possible)
1. Religious tourism 3. Ecotourism
2. Cultural tourism 4.Other s (details)
5. Which destinations do you like in Angiang? (mark the appropriate answer, more answers possible)
1. Temple of Ba Chua Xu Nui Sam 5. Cam Mountain Entertaiment park
2. Tra Su cajuput forest 6. Oc Eo archaeological park
3. Xvayton Khmer pagoda 7. Ton Duc Thang president monument
4. Cho Moi Islands 8.Other s (details)……………..
6. Do you organize your trip by tourist company or by your own self?
1. Your self
2. Tourist company
PART II. YOUR EVALUATING ON THE FACTORS EFFECTING ON LINKAGES IN TOURISM DEVELOPMENT BETWEEN AN GIANG AND THE NEIGHBORING REGION (CAN THO, KIEN GIANG, DONG THAP)
7. Please indicate your oppinions of the factors effecting on linkages in tourism development between An Giang and the neighboring region with following levels: 1 Total disagree 2 Disagree 3 – No ideas 4 Agree 5 – Total agree
Evaluating | |||||
Tourism natural resources has more advantages for linkage with the neighboring region | |||||
Topology | 1 | 2 | 3 | 4 | 5 |
Climate | 1 | 2 | 3 | 4 | 5 |
River and canals | |||||
Ecological system | 1 | 2 | 3 | 4 | 5 |
Argricultural landscape | |||||
Tourism cultural resources has more advantages for linkage with the neighboring region | |||||
Festivals | 1 | 2 | 3 | 4 | 5 |
Cultural, historical monuments | 1 | 2 | 3 | 4 | 5 |
Old trade villages | 1 | 2 | 3 | 4 | 5 |
Cuisine, foods | 1 | 2 | 3 | 4 | 5 |
Sport, Culture and Architech events | 1 | 2 | 3 | 4 | 5 |
Infrastructure and technology has more advantages for linkage with the neighboring region | |||||
Transportation | 1 | 2 | 3 | 4 | 5 |
Communication system | 1 | 2 | 3 | 4 | 5 |
Electricity and water servive providers | 1 | 2 | 3 | 4 | 5 |
Promoting and managing technology for tourism | 1 | 2 | 3 | 4 | 5 |
Supplements (location and distance, social – economic, secure and politic) | |||||
Geographical location | 1 | 2 | 3 | 4 | 5 |
Secure, politic | 1 | 2 | 3 | 4 | 5 |
Income and demand | 1 | 2 | 3 | 4 | 5 |
Policies for tourim development with the neighboring region | |||||
Policies for linkages in tourism | 1 | 2 | 3 | 4 | 5 |
Policies for investment in regional tourism | 1 | 2 | 3 | 4 | 5 |
Policies for regional promoting | 1 | 2 | 3 | 4 | 5 |
Policies for regional products development | 1 | 2 | 3 | 4 | 5 |
Policies for regional infrastructure | 1 | 2 | 3 | 4 | 5 |
Policies for regional action plan | 1 | 2 | 3 | 4 | 5 |
TOURISM DEVELOPMENT IN AN GIANG WITH THE NEIGHBORING REGION | |||||
Tourism sector has high growth with the neighboring region | 1 | 2 | 3 | 4 | 5 |
Tourism sector contribute to change regional and province economic structure | 1 | 2 | 3 | 4 | 5 |
Tourism sector promotes the cooperation of An Giang and the neighboring region. | 1 | 2 | 3 | 4 | 5 |
Có thể bạn quan tâm!
-
 Nguyen Phu Thang, Hoang Tu Uyen “An Evaluating On The Competitiveness Of Tourism Sector In An Giang Province, Vietnam” 19Th International Joint World Cultural Tourism Conference 5Th World
 -
 Và Phương Hướng Nhiệm Vụ Năm 2016. Long Xuyên.
 -
 Ý Kiến Của Chuyên Gia Về Các Chỉ Tiêu Đánh Giá Điểm Dl Ở An Giang
 -
 Số Lượt Khách Du Lịch Đến An Giang Và Vpc Giai Đoạn 2007 – 2017 (Nghìn Lượt Khách)
 -
 Sơ Đồ Radar Và Hộp Thông Tin Các Điểm Du Lịch Tỉnh An Giang
 -
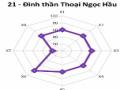 Hộp Thông Tin Các Điểm Du Lịch Tỉnh An Giang
Xem toàn bộ 266 trang tài liệu này.

PART III. YOUR FEEDBACKS OF TOURIST DESTINATIONS
8. Below are listed some statements which refer to the indicators of tourist destinations you have experienced in. For each statement please indicate to what extent you agree with it. “1” means lowest level, and “5” means highest level
For example: Attraction
1 – Completely not attractive 5 – Completely attractive
Indicators | Evaluations | |||||
1 | Attraction | 1 | 2 | 3 | 4 | 5 |
2 | Time of activities | 1 | 2 | 3 | 4 | 5 |
3 | Location and approaching | 1 | 2 | 3 | 4 | 5 |
4 | Tourism infrastructure (transportations, communication, hotel and restaurants, etc) | 1 | 2 | 3 | 4 | 5 |
5 | Connection ability | 1 | 2 | 3 | 4 | 5 |
6 | Capacity | 1 | 2 | 3 | 4 | 5 |
7 | Management level | 1 | 2 | 3 | 4 | 5 |
8 | Enviroment | 1 | 2 | 3 | 4 | 5 |
9 | Staffs (actress, waitress in restaurant, hotels, ect) | 1 | 2 | 3 | 4 | 5 |
9. Choose apropriate solutions you think best for Angiang tourism development in linked with neighbouring provinces (Can Tho, Kien Giang, Dong Thap)
Solutions | Yes | No | |
1 | Designing tours connecting other tourist destination of the provice | 1 | 2 |
2 | Enhancing the quality of the transportation in Angiang and neighbouring area | 1 | 2 |
3 | Preserving of the historic sites | 1 | 2 |
4 | Increasing of level of security in destinations | 1 | 2 |
5 | Encouraging the advertising program for tourist | 1 | 2 |
6 | Improving of the quality of staffs | 1 | 2 |
7 | Adjust the prices and convenient | 1 | 2 |
8 | Other | 1 | 2 |
PART IV. YOUR PROFILE
10. Country…………………………
11. Education:
1. Under highschool (primary, secondary) 3. Colleges and career training school
2. High school 4. University and higher
12. Ocupation:
1. Worker/staff 3. Businesses
2. Student/pupil 4. Others
13. Age……………….
14. Gender: Male Fe rmale
15. Income (per month – US dollars):
1. < 500 3. 1000 2000
2. 500 – 1000 4. > 2000
THANK YOU FOR YOUR COOPERATION!
PHỤ LỤC 2.2. KẾT QUẢ THỐNG KÊ MÔ TẢ
2.2.1. Kênh tham khảo
$thamkhao Frequencies
Responses | Percent of Cases | |||
N | Percent | |||
thamkhaoa | Bạn bè, người thân | 202 | 55.6% | 68.0% |
Internet | 83 | 22.9% | 27.9% | |
Sách báo, tạp chí | 26 | 7.2% | 8.8% | |
Tivi, radio | 34 | 9.4% | 11.4% | |
Công ty du lịch, lữ hành | 8 | 2.2% | 2.7% | |
Khác | 10 | 2.8% | 3.4% | |
Total | 363 | 100.0% | 122.2% |
2.2.2. Địa điểm yêu thích
$diadiem Frequencies
Responses | Percent of Cases | |||
N | Percent | |||
diadiema | Miếu Bà Chúa Xứ núi Sam | 232 | 34.3% | 77.3% |
Rừng tràm Trà Sư | 135 | 20.0% | 45.0% | |
Chùa Xvayton | 20 | 3.0% | 6.7% | |
Cù lao Giêng | 7 | 1.0% | 2.3% | |
Khu du lịch núi Cấm | 211 | 31.2% | 70.3% | |
Khu di chỉ nghệ thuật Óc Eo | 37 | 5.5% | 12.3% | |
Khu lưu niệm chủ tịch Tôn Đức Thắng | 32 | 4.7% | 10.7% | |
Khác | 2 | .3% | .7% | |
Total | 676 | 100.0% | 225.3% |
2.2.3. Số lần đến An Giang
Frequency | Percent | Valid Percent | Cumulative Percent | ||
Valid | 1 lần | 118 | 39.3 | 39.3 | 39.3 |
2 lần | 67 | 22.3 | 22.3 | 61.7 | |
3 lần | 58 | 19.3 | 19.3 | 81.0 | |
> 3 lần | 57 | 19.0 | 19.0 | 100.0 | |
Total | 300 | 100.0 | 100.0 |
2.2. 4. Mục đích của khách
Frequency | Percent | Valid Percent | Cumulative Percent | ||
Valid | Tôn giáo, tín ngưỡng | 143 | 47.7 | 47.7 | 47.7 |
Thăm họ hàng, bạn bè | 37 | 12.3 | 12.3 | 60.0 | |
Du lịch nghỉ dưỡng, tham quan | 83 | 27.7 | 27.7 | 87.7 | |
Thông tin, báo chí | 10 | 3.3 | 3.3 | 91.0 | |
Thương mại | 2 | .7 | .7 | 91.7 | |
Chữa bệnh | 4 | 1.3 | 1.3 | 93.0 | |
Khác | 21 | 7.0 | 7.0 | 100.0 | |
Total | 300 | 100.0 | 100.0 |
2.2.5. Sản phẩm loại hình yêu thích
Frequency | Percent | Valid Percent | Cumulative Percent | ||
Valid | Du lịch tâm linh | 123 | 41.0 | 41.0 | 41.0 |
Du lịch văn hóa | 70 | 23.3 | 23.3 | 64.3 | |
Du lịch sinh thái | 100 | 33.3 | 33.3 | 97.7 | |
Khác | 7 | 2.3 | 2.3 | 100.0 | |
Total | 300 | 100.0 | 100.0 | ||
2.2.6. Hình thức tổ chức
Hình thức tổ chức
Frequency | Percent | Valid Percent | Cumulative Percent | ||
Valid | Tự tổ chức | 260 | 86.7 | 86.7 | 86.7 |
Theo chương trình du lịch | 27 | 9.0 | 9.0 | 95.7 | |
Hình thức khác | 13 | 4.3 | 4.3 | 100.0 | |
Total | 300 | 100.0 | 100.0 |
2.2.7. Nghề nghiệp
Nghề nghiệp
Frequency | Percent | Valid Percent | Cumulative Percent | ||
Valid | Công nhân viên chức | 64 | 21.3 | 21.3 | 21.3 |
Học sinh sinh viên | 63 | 21.0 | 21.0 | 42.3 | |
Kinh doanh | 96 | 32.0 | 32.0 | 74.3 | |
Khác | 77 | 25.7 | 25.7 | 100.0 | |
Total | 300 | 100.0 | 100.0 |
2.2.8. Giới tính
Giới tính
Frequency | Percent | Valid Percent | Cumulative Percent | ||
Valid | Nam | 168 | 56.0 | 56.0 | 56.0 |
Nữ | 132 | 44.0 | 44.0 | 100.0 | |
Total | 300 | 100.0 | 100.0 |
2.2.9. Thu nhập
Thu nhập
Frequency | Percent | Valid Percent | Cumulative Percent | ||
Valid | < 2 triệu | 72 | 24.0 | 24.0 | 24.0 |
2-6 triệu | 133 | 44.3 | 44.3 | 68.3 | |
6-10 triệu | 77 | 25.7 | 25.7 | 94.0 | |
10-20 triệu | 15 | 5.0 | 5.0 | 99.0 | |
>20 triệu | 3 | 1.0 | 1.0 | 100.0 | |
Total | 300 | 100.0 | 100.0 |
2.2.10. Tuổi
nhóm tuổi
Frequency | Percent | Valid Percent | Cumulative Percent | ||
Valid | <25 | 111 | 37.0 | 37.0 | 37.0 |
26 - 35 | 81 | 27.0 | 27.0 | 64.0 | |
36 - 50 | 58 | 19.3 | 19.3 | 83.3 | |
>50 | 50 | 16.7 | 16.7 | 100.0 | |
Total | 300 | 100.0 | 100.0 |
PHỤ LỤC 2.3. PHÂN TÍCH EFA VÀ MLRA
TT | Nhóm nhân tố | Kí hiệu nhân tố | Giải thích |
1 | CSHT và công nghệ | X1 | Giao thông vận tải |
X2 | Điện, nước | ||
X3 | TTLL và công nghệ | ||
2 | Chính sách | X4 | Chính sách liên kết vùng |
X5 | Chính sách thu hút đầu tư | ||
X6 | Chính sách quảng bá, xúc tiến | ||
X7 | Chính sách phát triển sản phẩm | ||
X8 | Chính sách hạ tầng | ||
X9 | Chính sách quy hoạch | ||
3 | TNDL | X10 | Địa hình |
X11 | Khí hậu | ||
X12 | Sông ngòi | ||
X13 | Hệ sinh thái | ||
X14 | Cảnh quan sinh thái nông nghiệp | ||
X15 | Lễ hội | ||
X16 | Di tích LS – VH | ||
X17 | Làng nghề | ||
X18 | Ẩm thực | ||
X19 | Sự kiện văn hóa, thể thao, xã hội | ||
4 | Các yếu tố bổ trợ (vị trí – khoảng cách, tình hình kinh tế, xã hội, an ninh, chính trị) | X20 | Vị trí – khoảng cách |
X21 | Đời sống kinh tế, xã hội | ||
X22 | Tình hình an ninh, chính trị |
2.3.1. Mã hóa biến (nhân tố) ảnh hưởng đến liên kết giữa An Giang và vùng phụ cận
2.3.2. Hệ số Cronbach Anpha và Item Correlation
Reliability Statistics
Item-Total Statistics
Cronbach's Alpha | N of Items |
.806 | 3 |
Scale Mean if Item Deleted | Scale Variance if Item Deleted | Corrected Item- Total Correlation | Cronbach's Alpha if Item Deleted | |
X1 | 7.96 | 1.734 | .597 | .795 |
X2 | 8.10 | 1.613 | .714 | .671 |
X3 | 8.05 | 1.750 | .654 | .735 |
Reliability Statistics
N of Items | |
.849 | 6 |
Scale Mean if Item Deleted | Scale Variance if Item Deleted | Corrected Item- Total Correlation | Cronbach's Alpha if Item Deleted | |
X4 | 20.53 | 8.163 | .613 | .827 |
X5 | 20.50 | 8.565 | .606 | .829 |
X6 | 20.60 | 8.000 | .683 | .814 |
X7 | 20.68 | 8.131 | .631 | .824 |
X8 | 20.70 | 8.132 | .653 | .819 |
X9 |
Item-Total Statistics
20.80 8.007 .606 .829
Reliability Statistics
N of Items | |
.784 | 5 |
Reliability Statistics
N of Items | |
.867 | 5 |
Item-Total Statistics
Scale Mean if Item Deleted | Scale Variance if Item Deleted | Corrected Item- Total Correlation | Cronbach's Alpha if Item Deleted | |
X1 | 7.96 | 1.734 | .597 | .795 |
X2 | 8.10 | 1.613 | .714 | .671 |
X3 | 8.05 | 1.750 | .654 | .735 |
Item-Total Statistics
Scale Mean if Item Deleted | Scale Variance if Item Deleted | Corrected Item- Total Correlation | Cronbach's Alpha if Item Deleted | |
X4 | 20.53 | 8.163 | .613 | .827 |
X5 | 20.50 | 8.565 | .606 | .829 |
X6 | 20.60 | 8.000 | .683 | .814 |
X7 | 20.68 | 8.131 | .631 | .824 |
X8 | 20.70 | 8.132 | .653 | .819 |
X9 | 20.80 | 8.007 | .606 | .829 |
Item-Total Statistics
Scale Mean if Item Deleted | Scale Variance if Item Deleted | Corrected Item- Total Correlation | Cronbach's Alpha if Item Deleted | |
X10 | 14.73 | 4.994 | .436 | .781 |
X11 | 14.81 | 4.576 | .573 | .739 |
X12 | 14.83 | 4.411 | .615 | .725 |
X13 | 14.75 | 4.282 | .646 | .713 |
X14 | 14.84 | 4.514 | .530 | .754 |
Item-Total Statistics
Scale Mean if Item Deleted | Scale Variance if Item Deleted | Corrected Item- Total Correlation | Cronbach's Alpha if Item Deleted | |
X15 | 14.99 | 5.609 | .598 | .860 |
X17 | 14.97 | 5.103 | .720 | .831 |
X18 | 14.90 | 5.261 | .725 | .830 |
X19 | 14.89 | 5.235 | .726 | .830 |
Item-Total Statistics
Scale Mean if Item Deleted | Scale Variance if Item Deleted | Corrected Item- Total Correlation | Cronbach's Alpha if Item Deleted | |
X20 | 7.04 | 2.727 | .668 | .813 |
X21 | 6.66 | 2.479 | .832 | .650 |
X22 | 6.41 | 2.871 | .622 | .855 |
2.3.3. Kiểm định KMO và Bartlett's; Tổng phương sai trích (Total Variance Explained)
KMO và Bartlett's
.796 | ||
Bartlett's Test of Sphericity | Approx. Chi-Square | 2938.569 |
Df | 231 |
Total Variance Explained
Extraction Sums of Squared Loadings | ||||
Total | Total | % of Variance | Cumulative % | |
1 | 5.599 | 5.599 | 25.448 | 25.448 |
2 | 2.646 | 2.646 | 12.026 | 37.474 |
3 | 2.586 | 2.586 | 11.755 | 49.229 |
4 | 1.907 | 1.907 | 8.668 | 57.897 |
5 | 1.314 | 1.314 | 5.974 | 63.871 |
Extraction Method: Principal Component Analysis
2.3.4. Ma trận xoay Rotated Component Matrixa
Component | |||||
1 | 2 | 3 | 4 | 5 | |
X8 | .772 | ||||
X6 | .764 | ||||
X7 | .756 | ||||
X5 | .705 | ||||
X9 | .680 | ||||
X4 | .662 | ||||
X19 | .798 | ||||
X17 | .792 | ||||
X16 | .786 | ||||
X18 | .784 | ||||
X15 | .740 | ||||
X13 | .783 | ||||
X12 | .769 | ||||
X11 | .718 | ||||
X14 | .689 | ||||
X10 | .607 | ||||
X21 | .934 | ||||
X20 | .845 | ||||
X22 | .802 | ||||
X2 | .870 | ||||
X3 | .799 | ||||
X1 | .767 |
Extraction Method: Principal Component Analysis. Rotation Method: Varimax with Kaiser Normalization.
2.3.5. Phân tích MRLA
Model Summary
R | R Square | Adjusted R Square | Std. Error of the Estimate | Durbin-Watson | |
1 | .604a | .364 | .354 | .39876 | 1.780 |
a. Predictors: (Constant), VT_KT, TN_TN, HATANG, TN_NV, CHINHSACH
b. Dependent Variable: PHATTRIEN
ANOVAb
Sum of Squares | df | Mean Square | F | Sig. | ||
1 | Regression | 26.794 | 5 | 5.359 | 33.702 | .000a |
Residual | 46.748 | 294 | .159 | |||
Total | 73.542 | 299 |
a. Predictors: (Constant), VT_KT, TN_TN, HATANG, TN_NV, CHINHSACH