Phụ lục 31. Thực trạng khách du lịch Việt Nam 2005-2014
Phụ lục 32. Thực trạng thu từ du lịch và đóng góp GDP 2005-2014
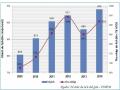
Phụ lục 33. Số liệu thực trạng phát triển du lịch Việt Nam 2005-2014
Các chỉ tiêu | 2005 | 2006 | 2007 | 2008 | 2009 | 2010 | 2011 | 2012 | 2013 | 2014 | |
1 | Khách du lịch (a) | 14.030.050 | 15.627.988 | 15.928.735 | 17.427.873 | 19.477.500 | 21.083.486 | 23.429.439 | 24.735.792 | 28.772.360 | 33.000.000 |
Khách quốc tế | 2.330.000 | 2.628.000 | 2.428.700 | 2.927.900 | 3.477.500 | 3.583.500 | 4.229.400 | 4.235.800 | 3.772.360 | 5.200.000 | |
Khách nội địa | 11.700.000 | 13.000.000 | 13.500.000 | 14.500.000 | 16.000.000 | 17.500.000 | 19.200.000 | 20.500.000 | 25.000.000 | 28.000.000 | |
2 | Ngày khách (b) | 43.235.275 | 50.591.135 | 52.643.675 | 61.039.365 | 71.787.500 | 87.284.219 | ||||
NK quốc tế | 12.815.275 | 14.191.135 | 12.143.675 | 14.639.365 | 17.387.500 | 20.784.218 | 25.376.634 | 26.261.910 | 23.388.600 | 33.700.000 | |
NK nội địa | 30.420.000 | 36.400.000 | 40.500.000 | 46.400.000 | 54.400.000 | 66.500.000 | 80.640.000 | 86.100.000 | |||
3 | Tổng thu từ khách du lịch (ngìn tỷ đồng) (a) | 20,5 | 23,0 | 22,0 | 26,0 | 30,0 | 51,0 | 56,0 | 60,0 | 68,0 | 96,0 |
4 | GDP du lịch (Ngìn tỷ đồng - Giá so sánh năm 2004) | 10,10 | 10,93 | 10,30 | 12,82 | 13,84 | 23,23 | 20,50 | 24,38 | 27,10 | 37,40 |
Tổng GDP (Ngìn tỷ đồng - Giá so sánh năm 2004) (c) | 292,54 | 313,25 | 336,24 | 362,44 | 393,03 | 425,37 | 461,34 | 489,83 | 516,57 | 645,00* | |
Tỷ trọng GDP du lịch/ tổng GDP toàn quốc(%) | 3,46 | 3,49 | 3,06 | 3,55 | 3,52 | 5,46 | 5,43 | 4,99 | 5,25 | 5,80 | |
5 | Lao động (b) | 150.662 | 196.873 | 208.777 | 241.685 | 275.128 | 310.675 | 391.177 | 424.740 | 434.240 | 450.000 |
6 | Cơ sở lưu trú (b) | 4.366 | 4.773 | 5.620 | 6.567 | 7.603 | 8.516 | 9.633 | 10.638 | 10.935 | 12.000 |
buồng lưu trú (b) | 86.809 | 95.033 | 110.639 | 129.137 | 150.105 | 168.315 | 189.436 | 205.979 | 209.076 | 235.000 |
Có thể bạn quan tâm!
-

 Thang Đo Các Yếu Tố Đầu Vào Và Mức Độ Hấp Dẫn Du Lịch
 -
 Danh Sách Các Đơn Vị Hcsn Du Lịch Có Các Chuyên Gia Tham Gia Chấm Điểm Bộ Tiêu Chí Lý Thuyết Đánh Giá Năng Lực Cạnh Tranh Cấp Tỉnh Trong Lĩnh Vực
 -
 Nghiên cứu mô hình năng lực cạnh tranh cấp tỉnh trong lĩnh vực du lịch - 27
Xem toàn bộ 233 trang tài liệu này.

Nguồn: a) Bộ VHTT&DL, Tổng cục Du lịch; b) Tổng hợp báo cáo các Sở VHTT&DL; c) Niên giám thống kê - Tổng cục Thống kê; * Viện NCPT Du lịch.
41
Phụ lục 34. Chỉ số năng lực cạnh tranh toàn cầu GCI của Việt Nam năm 2013 do Diễn đàn Kinh tế Thế giới WEF công bố tháng 4/2014.
Phụ lục 35. Chỉ số năng lực cạnh tranh du lịch và lữ hành TTCI của Việt Nam năm 2013 do Diễn đàn Kinh tế Thế giới WEF công bố tháng 4/2014
The Global Competitiveness Index in detail
INDICATOR VALUE RANK VALU INDICATOR VALUE RANK E
1st pillar: Institutions
1.01 Property rights ........................................................3.5 113
1.02 Intellectual property protection ...............................2.9 116
1.03 Diversion of public funds ........................................3.2 74
1.04 Public trust in politicians .........................................3.4 46
1.05 Irregular payments and bribes................................3.1 116
1.06 Judicial independence............................................3.4 89
1.07 Favoritism in decisions of government officials ......3.1 71
1.08 Wastefulness of government spending ..................2.7 103
1.09 Burden of government regulation ...........................3.1 106
1.10 Efficiency of legal framework in settling disputes ...3.4 93
1.11 Efficiency of legal framework in challenging regs ....3.3 79
1.12 Transparency of government policymaking.............3.6 121
1.13 Business costs of terrorism ....................................5.4 75
1.14 Business costs of crime and violence ....................4.8 64
1.15 Organized crime.....................................................4.9 78
1.16 Reliability of police services ....................................3.8 95
1.17 Ethical behavior of firms .........................................3.7 91
1.18 Strength of auditing and reporting standards .........3.4 134
1.19 Efficacy of corporate boards...................................4.2 107
1.20 Protection of minority shareholders’ interests.........3.4 126
1.21 Strength of investor protection, 0-10 (best)* .........3.0 134
2nd pillar: Infrastructure
2.01 Quality of overall infrastructure................................3.4 110
2.02 Quality of roads ......................................................3.1 102
2.03 Quality of railroad infrastructure ..............................3.0 58
2.04 Quality of port infrastructure ...................................3.7 98
2.05 Quality of air transport infrastructure ......................4.0 92
2.06 Available airline seat km/week, millions* .............734.0 32
2.07 Quality of electricity supply.....................................4.0 95
2.08 Mobile telephone subscriptions/100 pop.* ........149.4 21
2.09 Fixed telephone lines/100 pop.* ...........................11.4 88
3rd pillar: Macroeconomic environment
3.01 Government budget balance, % GDP*..................-5.2 121
3.02 Gross national savings, % GDP*...........................30.7 22
3.03 Inflation, annual % change*....................................9.1 127
3.04 General government debt, % GDP* .....................52.1 96
3.05 Country credit rating, 0-100 (best)* .....................43.4 75
4th pillar: Health and primary education
4.01 Business impact of malaria ....................................4.6 108
4.02 Malaria cases/100,000 pop.* ...............................28.4 92
4.03 Business impact of tuberculosis .............................4.3 117
4.04 Tuberculosis cases/100,000 pop.* .....................199.0 121
4.05 Business impact of HIV/AIDS.................................4.4 112
4.06 HIV prevalence, % adult pop.* .............................0.50 88
4.07 Infant mortality, deaths/1,000 live births*..............17.3 81
4.08 Life expectancy, years* .........................................75.1 52
4.09 Quality of primary education...................................3.4 97
4.10 Primary education enrollment, net %* ..................99.3 15
5th pillar: Higher education and training
5.01 Secondary education enrollment, gross %* .........77.2 96
5.02 Tertiary education enrollment, gross %*................24.4 89
5.03 Quality of the educational system ..........................3.4 95
5.04 Quality of math and science education...................3.9 85
5.05 Quality of management schools .............................3.3 125
5.06 Internet access in schools ......................................5.1 41
5.07 Availability of research and training services ...........3.3 125
5.08 Extent of staff training.............................................3.7 98
6th pillar: Goods market efficiency
6.01 Intensity of local competition ..................................5.2 51
6.02 Extent of market dominance...................................3.8 74
6.03 Effectiveness of anti-monopoly policy ....................4.0 82
6.04 Effect of taxation on incentives to invest ................3.5 97
6.05 Total tax rate, % profits* .......................................34.5 55
6th pillar: Goods market efficiency (cont’d.)
6.06 No. procedures to start a business* .........................10 116
6.07 No. days to start a business*...................................34 114
6.08 Agricultural policy costs...........................................4.1 47
6.09 Prevalence of trade barriers.....................................4.0 104
6.10 Trade tariffs, % duty*...............................................8.0 92
6.11 Prevalence of foreign ownership ..............................4.2 101
6.12 Business impact of rules on FDI..............................4.7 53
6.13 Burden of customs procedures ..............................3.5 99
6.14 Imports as a percentage of GDP* .........................91.4 11
6.15 Degree of customer orientation...............................4.2 100
6.16 Buyer sophistication ................................................3.5 60
7th pillar: Labor market efficiency
7.01 Cooperation in labor-employer relations .................4.4 64
7.02 Flexibility of wage determination .............................5.1 69
7.03 Hiring and firing practices........................................3.9 81
7.04 Redundancy costs, weeks of salary*.....................24.6 111
7.05 Effect of taxation on incentives to work ...................3.4 99
7.06 Pay and productivity................................................4.7 15
7.07 Reliance on professional management ....................3.6 119
7.08 Country capacity to retain talent..............................3.0 95
7.09 Country capacity to attract talent............................3.5 69
7.10 Women in labor force, ratio to men*......................0.92 21
8th pillar: Financial market development
8.01 Availability of financial services ................................4.0 93
8.02 Affordability of financial services ..............................3.8 97
8.03 Financing through local equity market.....................3.6 57
8.04 Ease of access to loans ..........................................2.3 113
8.05 Venture capital availability........................................2.6 78
8.06 Soundness of banks................................................3.7 134
8.07 Regulation of securities exchanges.........................3.2 118
8.08 Legal rights index, 0-10 (best)* ..................................8 28
9th pillar: Technological readiness
9.01 Availability of latest technologies..............................3.7 134
9.02 Firm-level technology absorption ............................3.8 135
9.03 FDI and technology transfer ....................................4.1 103
9.04 Individuals using Internet, %* ................................39.5 83
9.05 Fixed broadband Internet subscriptions/100 pop.* ... 5.0 79
9.06 Int’l Internet bandwidth, kb/s per user* .................13.5 87
9.07 Mobile broadband subscriptions/100 pop.* ..........19.0 69
10th pillar: Market size
10.01 Domestic market size index, 1-7 (best)* .................4.3 39
10.02 Foreign market size index, 1-7 (best)* ....................5.6 24
10.03 GDP (PPP$ billions)* ...........................................320.7 41
10.04 Exports as a percentage of GDP*.........................89.7 13
11th pillar: Business sophistication
11.01 Local supplier quantity ............................................5.0 30
11.02 Local supplier quality ..............................................4.2 89
11.03 State of cluster development ..................................3.9 68
11.04 Nature of competitive advantage ............................2.7 130
11.05 Value chain breadth.................................................3.2 115
11.06 Control of international distribution..........................3.9 87
11.07 Production process sophistication ..........................3.2 111
11.08 Extent of marketing .................................................3.7 104
11.09 Willingness to delegate authority ............................3.4 105
12th pillar: Innovation
12.01 Capacity for innovation ...........................................3.4 86
12.02 Quality of scientific research institutions .................3.4 89
12.03 Company spending on R&D ...................................3.2 59
12.04 University-industry collaboration in R&D ..................3.3 87
12.05 Gov’t procurement of advanced tech products ......4.0 30
12.06 Availability of scientists and engineers .....................3.8 88
12.07 PCT patents, applications/million pop.*...................0.1 92
Notes: Values are on a 1-to-7 scale unless otherwise annotated with an asterisk (*). For further details and explanation, please refer to the section 389 | The Global Competitiveness Report 2013-2014 © 2013 World Economic Forum “How to Read the Country/Economy Profiles” on page 97.