PHỤ LỤC 3: PHÂN TÍCH NHÂN TỐ KHÁM PHÁ – EFA
3.1 Phân tích nhân tố khám phá biến độc lập
Kaiser-Meyer-Olkin Measure of Sampling Adequacy. | .784 | |
Approx. Chi-Square | 5709.510 | |
Bartlett's Test of Sphericity | df | 231 |
Sig. | .000 | |
Có thể bạn quan tâm!
-

 Thống Kê Mô Tả Các Biến Quan Sát Nhân Tố Phương Tiện Hữu Hình
 -
 Tăng Cường Sự Đảm Bảo Đối Với Khách Hàng
 -
 Anh/chị Vui Lòng Cho Biết Mức Thu Nhập Hàng Tháng Của Mình. *
 -
 Giải pháp nâng cao chất lượng dịch vụ ngân hàng đối với khách hàng cá nhân tại Ngân hàng TMCP Ngoại Thương Việt Nam - 13
Xem toàn bộ 111 trang tài liệu này.
Total Variance Explained
Initial Eigenvalues | Extraction Sums of Squared Loadings | Rotation Sums of Squared Loadings | |||||||
Total | % of Variance | Cumulative % | Total | % of Variance | Cumulative % | Total | % of Variance | Cumulative % | |
1 | 7.928 | 36.036 | 36.036 | 7.928 | 36.036 | 36.036 | 3.035 | 13.795 | 13.795 |
2 | 2.394 | 10.884 | 46.920 | 2.394 | 10.884 | 46.920 | 2.911 | 13.230 | 27.024 |
3 | 1.694 | 7.698 | 54.618 | 1.694 | 7.698 | 54.618 | 2.713 | 12.333 | 39.357 |
4 | 1.418 | 6.444 | 61.062 | 1.418 | 6.444 | 61.062 | 2.700 | 12.275 | 51.632 |
5 | 1.327 | 6.031 | 67.094 | 1.327 | 6.031 | 67.094 | 2.330 | 10.592 | 62.224 |
6 | 1.152 | 5.237 | 72.330 | 1.152 | 5.237 | 72.330 | 2.223 | 10.106 | 72.330 |
7 | .989 | 4.498 | 76.828 | ||||||
8 | .797 | 3.622 | 80.450 | ||||||
9 | .729 | 3.314 | 83.763 | ||||||
10 | .606 | 2.755 | 86.518 | ||||||
11 | .530 | 2.411 | 88.929 | ||||||
12 | .452 | 2.056 | 90.985 | ||||||
13 | .441 | 2.006 | 92.991 | ||||||
14 | .410 | 1.865 | 94.856 | ||||||
15 | .291 | 1.321 | 96.177 | ||||||
16 | .250 | 1.137 | 97.314 | ||||||
17 | .227 | 1.034 | 98.348 | ||||||
18 | .201 | .914 | 99.262 | ||||||
19 | .093 | .421 | 99.682 | ||||||
20 | .031 | .142 | 99.825 | ||||||
21 | .023 | .105 | 99.929 | ||||||
22 | .016 | .071 | 100.000 |
Extraction Method: Principal Component Analysis.
Rotated Component Matrixa
Component | ||||||
1 | 2 | 3 | 4 | 5 | 6 | |
ASS1 | .851 | |||||
ASS2 | .802 | |||||
ASS3 | .910 | |||||
ASS4 | .873 | |||||
REL1 | .866 | |||||
REL2 | .837 | |||||
REL3 | .909 | |||||
REL4 | .884 | |||||
REL5 | .563 | |||||
EMP1 | .668 | |||||
EMP2 | .610 | |||||
EMP3 | .831 | |||||
EMP4 | .563 | |||||
EMP5 | .823 | |||||
RES1 | ||||||
RES2 | .627 | |||||
RES3 | ||||||
RES4 | .691 | |||||
TAN1 | ||||||
TAN2 | ||||||
TAN3 | .763 | |||||
TAN4 | .773 |
Extraction Method: Principal Component Analysis. Rotation Method: Varimax with Kaiser Normalization.
a. Rotation converged in 8 iterations.
3.2 Phân tích nhân tố khám phá biến phụ thuộc
Kaiser-Meyer-Olkin Measure of Sampling Adequacy. | .626 | |
Approx. Chi-Square | 328.693 | |
Bartlett's Test of Sphericity | df | 6 |
Sig. | .000 | |
Total Variance Explained
Initial Eigenvalues | Extraction Sums of Squared Loadings | |||||
Total | % of Variance | Cumulative % | Total | % of Variance | Cumulative % | |
1 | 2.297 | 57.427 | 57.427 | 2.297 | 57.427 | 57.427 |
2 | .815 | 20.366 | 77.793 | |||
3 | .581 | 14.523 | 92.316 | |||
4 | .307 | 7.684 | 100.000 |
Extraction Method: Principal Component Analysis.
Component Matrixa
Component | |
1 | |
SAT1 | .675 |
SAT2 | .782 |
SAT3 | .755 |
SAT4 | .812 |
Extraction Method: Principal Component Analysis.
a. 1 components extracted.
PHỤ LỤC 4: PHÂN TÍCH HỒI QUY, TƯƠNG QUAN
4.1 Phân tích hồi quy
Model Summaryb
R | R Square | Adjusted R Square | Std. Error of the Estimate | Change Statistics | Durbin- Watson | |||||
R Square Change | F Change | df1 | df2 | Sig. F Change | ||||||
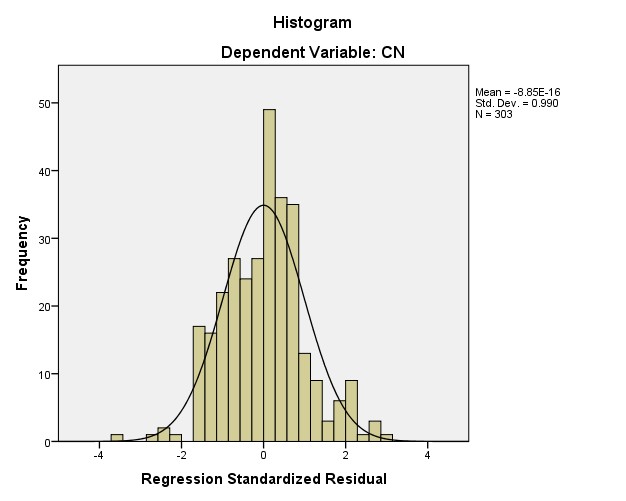
1 | .684a | .468 | .457 | .37157 | .468 | 43.386 | 6 | 296 | .000 | 1.717 |
a. Predictors: (Constant) F6-Khả năng đáp ứng, F4-Sự đồng cảm, F3-Sự đảm bảo, F5-Hiểu biết khách hàng, F2-Phương tiện hữu hình, F1-Mức độ tin cậy
b. Dependent Variable: CN-Cảm nhận
ANOVAa
Sum of Squares | df | Mean Square | F | Sig. | ||
Regression | 35.941 | 6 | 5.990 | 43.386 | .000b | |
1 | Residual | 40.867 | 296 | .138 | ||
Total | 76.809 | 302 |
a. Dependent Variable: CN-Cảm nhận
b. Predictors: (Constant F6-Khả năng đáp ứng, F4-Sự đồng cảm, F3-Sự đảm bảo, F5-Hiểu biết khách hàng, F2-Phương tiện hữu hình, F1-Mức độ tin cậy
Coefficientsa
Unstandardized Coefficients | Standardized Coefficients | T | Sig. | Collinearity Statistics | ||||
B | Std. Error | Beta | Tolerance | VIF | ||||
1 | (Constant) | .637 | .214 | 2.973 | .003 | |||
F1-REL | .234 | .053 | .255 | 4.384 | .000 | .532 | 1.881 | |
F2-TAN | .211 | .048 | .241 | 4.422 | .009 | .605 | 1.654 | |
F3-ASS | .139 | .038 | .189 | 3.637 | .000 | .663 | 1.509 | |
F4-EMP | .094 | .050 | .088 | 1.897 | .059 | .836 | 1.196 | |
F5-UND | -.034 | .036 | -.049 | -935 | .351 | .661 | 1.513 | |
F6-RES | .162 | .043 | .194 | 3.801 | .000 | .692 | 1.445 |
4.2 Phân tích tương quan
Correlations
ABSRES1 | F1 | F2 | F3 | F6 | |||
ABSRES1 | Correlation Coefficient | 1.000 | .086 | .214** | .013 | .107 | |
Sig. (2-tailed) | . | .136 | .000 | .819 | .062 | ||
N | 303 | 303 | 303 | 303 | 303 | ||
F1 | Correlation Coefficient | .086 | 1.000 | .450** | .577** | .454** | |
Sig. (2-tailed) | .136 | . | .000 | .000 | .000 | ||
N | 303 | 303 | 303 | 303 | 303 | ||
Spear man's rho | F2 | Correlation Coefficient | .214** | .450** | 1.000 | .345** | .372** |
Sig. (2-tailed) | .000 | .000 | . | .000 | .000 | ||
N | 303 | 303 | 303 | 303 | 303 | ||
F3 | Correlation Coefficient | .013 | .577** | .345** | 1.000 | .264** | |
Sig. (2-tailed) | .819 | .000 | .000 | . | .000 | ||
N | 303 | 303 | 303 | 303 | 303 | ||
F6 | Correlation Coefficient | .107 | .454** | .372** | .264** | 1.000 | |
Sig. (2-tailed) | .062 | .000 | .000 | .000 | . | ||
N | 303 | 303 | 303 | 303 | 303 |
**. Correlation is significant at the 0.01 level (2-tailed).
PHỤ LỤC 5: ĐỒ THỊ KIỂM ĐỊNH CÁC VI PHẠM GIẢ ĐỊNH