.636 | |||||
COSOVATCHAT4 | .632 | .372 | -.400 | ||
NHANVIEN2 | .614 | ||||
NHANVIEN1 | .584 | ||||
NHANVIEN4 | .573 | -.419 | .308 | ||
CHATLUONGDOAN3 | .431 | .726 | |||
CHATLUONGDOAN2 | .367 | .714 | |||
CHATLUONGDOAN4 | .413 | .693 | |||
CHATLUONGDOAN1 | .413 | .678 | |||
CHATLUONGDOAN5 | .400 | .510 | -.377 | ||
NHANVIEN6 | .433 | -.436 | .364 | -.403 | |
SUPHOIHOP1 | .435 | .682 | |||
SUPHOIHOP3 | .387 | .549 | .322 | .392 | |
NHANVIEN3 | .441 | -.503 | .487 | ||
SUPHOIHOP2 | .334 | .330 | .495 | .565 |
Có thể bạn quan tâm!
-
 Bản Đồ Vị Trí Khách Sạn New World Saigon Hotel
 -
 Một Số Hình Ảnh Giải Thưởng Của Khách Sạn Trong Thời Gian Qua
 -
 Đánh giá quy trình phục vụ tại nhà hàng Parkview của khách sạn New World Saigon Hotel - 21
Xem toàn bộ 184 trang tài liệu này.
Extraction Method: Principal Component Analysis.
a. 5 components extracted.
Rotated Component Matrixa
Component | |||||
1 | 2 | 3 | 4 | 5 | |
COSOVATCHAT2 | .819 | ||||
COSOVATCHAT3 | .768 | ||||
SUPHOIHOP4 | .724 | ||||
NHANVIEN5 | .718 | ||||
NHANVIEN1 | .636 | ||||
NHANVIEN2 | .492 | .386 | |||
CHATLUONGDOAN3 | .850 | ||||
CHATLUONGDOAN4 | .814 | ||||
CHATLUONGDOAN2 | .807 | ||||
CHATLUONGDOAN1 | .798 | ||||
CHATLUONGDOAN5 | .578 | .538 | |||
NHANVIEN3 | .871 |
.745 | .309 | |||
COSOVATCHAT5 | .370 | .679 | ||
COSOVATCHAT1 | .517 | .653 | ||
NHANVIEN4 | .441 | .467 | -.334 | |
SUPHOIHOP1 | .780 | .392 | ||
COSOVATCHAT4 | .480 | .671 | ||
SUPHOIHOP2 | .870 | |||
SUPHOIHOP3 | .785 |
Extraction Method: Principal Component Analysis. Rotation Method: Varimax with Kaiser Normalization.
a. Rotation converged in 7 iterations.
Component Transformation Matrix
1 | 2 | 3 | 4 | 5 | |
1 | .709 | .382 | .474 | .262 | .239 |
2 | -.310 | .902 | -.296 | .011 | .052 |
3 | .066 | -.191 | -.548 | .666 | .464 |
4 | -.603 | -.047 | .587 | .175 | .509 |
5 | .180 | -.038 | -.209 | -.676 | .682 |
Extraction Method: Principal Component Analysis. Rotation Method: Varimax with Kaiser Normalization.
Regression
Variables Entered/Removeda
Variables Entered | Variables Removed | Method | |
1 | meancl, meannhanvien, meansph, meancsvcb | . | Enter |
a. Dependent Variable: meanqt
b. All requested variables entered.
Model Summaryb
R | R Square | Adjusted R Square | Std. Error of the Estimate | |
1 | .711a | .505 | .499 | .36149 |
a. Predictors: (Constant), meancl, meannhanvien, meansph, meancsvc
b. Dependent Variable: meanqt
ANOVAa
Sum of Squares | df | Mean Square | F | Sig. | ||
1 | Regression | 40.711 | 4 | 10.178 | 77.885 | .000b |
Residual | 39.857 | 305 | .131 | |||
Total | 80.568 | 309 |
a. Dependent Variable: meanqt
b. Predictors: (Constant), meancl, meannhanvien, meansph, meancsvc
Coefficientsa
Unstandardized | Coefficients | Standardized Coefficients | t | Sig. | Collinearity | Statistics | ||
B | Std. Error | Beta | Tolerance | VIF | ||||
(Constant) | .313 | .132 | 2.378 | .018 | ||||
meancsvc | -.037 | .076 | -.033 | -.482 | .630 | .349 | 2.863 | |
meannhanvien | .144 | .088 | .104 | 1.626 | .105 | .400 | 2.498 | |
meansph | -.027 | .056 | -.023 | -.486 | .627 | .751 | 1.332 | |
meancl | .720 | .043 | .699 | 16.605 | .000 | .915 | 1.093 | |
a. Dependent Variable: meanqt
Collinearity Diagnosticsa
Dimension | Eigenvalue | Condition Index | Variance | Proportions | ||||
(Constant) | meancsvc | meannhanvien | meansph | meancl | ||||
1 | 1 | 4.881 | 1.000 | .00 | .00 | .00 | .00 | .00 |
2 | .056 | 9.297 | .00 | .05 | .03 | .01 | .81 | |
3 | .031 | 12.469 | .11 | .13 | .06 | .47 | .11 | |
4 | .022 | 14.743 | .59 | .07 | .04 | .42 | .06 | |
5 | .009 | 23.204 | .30 | .74 | .87 | .10 | .01 |
a. Dependent Variable: meanqt
Residuals Statisticsa
Minimum | Maximum | Mean | Std. Deviation | N | |
Predicted Value | 1.0919 | 4.0394 | 1.7594 | .36298 | 310 |
Residual | -1.32650 | 1.86023 | .00000 | .35915 | 310 |
Std. Predicted Value | -1.839 | 6.281 | .000 | 1.000 | 310 |
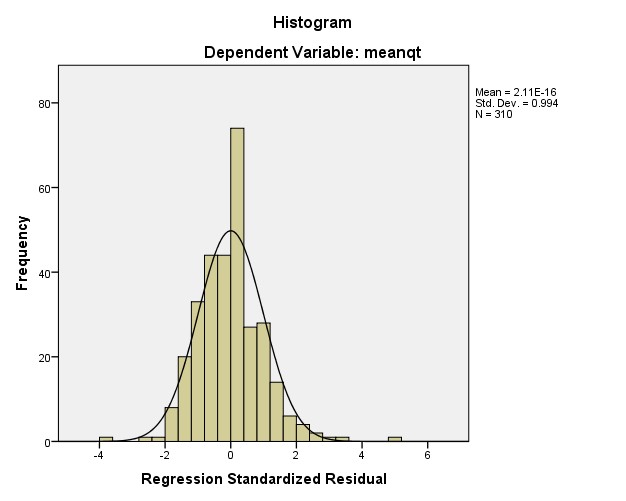
Std. Residual | -3.669 | 5.146 | .000 | .994 | 310 |
a. Dependent Variable: meanqt
Charts


