Bảng số 3: Cronbach’s Alpha thang đo nhân tố môi trường kinh doanh và chính sách nhà nước
Reliability Statistics
N of Items | |
.863 | 7 |
Có thể bạn quan tâm!
-

 Đối Với Nhân Tố Môi Trường Kinh Doanh Và Chính Sách Nhà Nước:
 -
 Lý Thị Ngọc Quyên, 2013. Phân Tích Những Nhân Tố Tác Động Đến Nợ Xấu Tại Các Ngân Hàng Thương Mại Việt Nam Trên Địa Bàn Thành Phố Hồ Chí Minh. Luận
 -
 Các nhân tố tác động đến nợ xấu tại Ngân hàng TMCP Nam Á - 13
Xem toàn bộ 112 trang tài liệu này.
Item-Total Statistics
Scale Mean if Item Deleted | Scale Variance if Item Deleted | Corrected Item- Total Correlation | Cronbach's Alpha if Item Deleted | |
VIMO1 | 22.5459 | 10.526 | .498 | .866 |
VIMO2 | 22.5051 | 10.672 | .711 | .835 |
VIMO3 | 22.5765 | 10.163 | .737 | .829 |
VIMO4 | 22.5459 | 10.382 | .738 | .830 |
VIMO5 | 22.7143 | 10.379 | .729 | .831 |
VIMO6 | 22.6633 | 10.676 | .619 | .845 |
VIMO7 | 22.5000 | 10.744 | .485 | .867 |
Bảng số 4: Cronbach’s Alpha thang đo nợ xấu
Reliability Statistics
N of Items | |
.713 | 3 |
Item-Total Statistics
Scale Mean if Item Deleted | Scale Variance if Item Deleted | Corrected Item- Total Correlation | Cronbach's Alpha if Item Deleted | |
NOXAU1 | 7.4847 | 1.738 | .543 | .610 |
NOXAU2 | 7.3520 | 1.604 | .530 | .632 |
NOXAU3 | 7.4694 | 1.891 | .531 | .630 |
Bảng số 5: Phân tích nhân tố các thành phần ảnh hưởng đến nợ xấu (lần 1)
Kaiser-Meyer-Olkin Measure of Sampling Adequacy. | .847 | |
Bartlett's Test of Sphericity | Approx. Chi-Square | 3.544E3 |
df | 253 | |
Sig. | .000 | |
Bảng số 5b: Total Variance Explained
Initial Eigenvalues | Extraction Sums of Squared Loadings | |||||
Total | % of Variance | Cumulative % | Total | % of Variance | Cumulative % | |
1 | 9.113 | 39.621 | 39.621 | 9.113 | 39.621 | 39.621 |
2 | 3.371 | 14.657 | 54.278 | 3.371 | 14.657 | 54.278 |
3 | 2.145 | 9.326 | 63.604 | 2.145 | 9.326 | 63.604 |
4 | .988 | 4.296 | 67.899 | |||
5 | .874 | 3.802 | 71.701 | |||
6 | .770 | 3.348 | 75.050 | |||
7 | .751 | 3.266 | 78.315 | |||
8 | .702 | 3.051 | 81.367 | |||
9 | .566 | 2.462 | 83.828 | |||
10 | .537 | 2.333 | 86.161 | |||
11 | .464 | 2.019 | 88.180 | |||
12 | .404 | 1.758 | 89.937 | |||
13 | .368 | 1.600 | 91.538 | |||
14 | .336 | 1.461 | 92.999 | |||
15 | .319 | 1.387 | 94.386 | |||
16 | .271 | 1.180 | 95.566 | |||
17 | .249 | 1.083 | 96.649 | |||
18 | .241 | 1.049 | 97.698 | |||
19 | .166 | .722 | 98.420 | |||
20 | .145 | .631 | 99.051 | |||
21 | .114 | .495 | 99.546 | |||
22 | .070 | .305 | 99.851 | |||
23 | .034 | .149 | 100.000 |
Extraction Method: Principal Component Analysis.
Bảng số 5c: Rotated Component Matrixa
Component | |||
1 | 2 | 3 | |
NGANHANG10 | .875 | .236 | |
NGANHANG9 | .838 | ||
NGANHANG3 | .815 | ||
NGANHANG4 | .809 | ||
NGANHANG2 | .805 | ||
NGANHANG11 | .798 | .202 | |
NGANHANG8 | .741 | .209 | |
NGANHANG5 | .723 | ||
NGANHANG1 | .716 | ||
KHACHHANG3 | .857 | ||
KHACHHANG2 | .824 | ||
KHACHHANG1 | .788 | ||
KHACHHANG5 | .780 | ||
VIMO7 | .430 | .479 | .308 |
KHACHHANG4 | .442 | .474 | |
NGANHANG6 | .283 | .455 | .402 |
VIMO5 | .863 | ||
VIMO6 | .838 | ||
VIMO4 | .822 | ||
VIMO2 | .306 | .749 | |
VIMO3 | .380 | .724 | |
NGANHANG7 | .222 | .461 | .492 |
VIMO1 | .402 | .438 |
Extraction Method: Principal Component Analysis. Rotation Method: Varimax with Kaiser Normalization.
a. Rotation converged in 5 iterations.
Bảng số 6: Phân tích nhân tố các thành phần ảnh hưởng đến nợ xấu (lần 2)
Kaiser-Meyer-Olkin Measure of Sampling Adequacy. | .812 | |
Bartlett's Test of Sphericity | Approx. Chi-Square | 2.914E3 |
df | 153 | |
Sig. | .000 | |
Bảng số 6b: Total Variance Explained
Initial Eigenvalues | Extraction Sums of Squared Loadings | |||||
Total | % of Variance | Cumulative % | Total | % of Variance | Cumulative % | |
1 | 7.365 | 40.919 | 40.919 | 7.365 | 40.919 | 40.919 |
2 | 3.083 | 17.128 | 58.046 | 3.083 | 17.128 | 58.046 |
3 | 2.076 | 11.534 | 69.581 | 2.076 | 11.534 | 69.581 |
4 | .908 | 5.044 | 74.625 | |||
5 | .702 | 3.898 | 78.522 | |||
6 | .633 | 3.518 | 82.041 | |||
7 | .508 | 2.820 | 84.861 | |||
8 | .463 | 2.571 | 87.432 | |||
9 | .389 | 2.159 | 89.591 | |||
10 | .375 | 2.085 | 91.676 | |||
11 | .334 | 1.856 | 93.532 | |||
12 | .282 | 1.567 | 95.098 | |||
13 | .253 | 1.406 | 96.504 | |||
14 | .235 | 1.307 | 97.811 | |||
15 | .157 | .874 | 98.685 | |||
16 | .130 | .720 | 99.404 | |||
17 | .072 | .401 | 99.806 | |||
18 | .035 | .194 | 100.000 |
Extraction Method: Principal Component Analysis.
Bảng số 6c: Rotated Component Matrixa
Component | |||
1 | 2 | 3 | |
NGANHANG10 | .879 | ||
NGANHANG9 | .842 | ||
NGANHANG3 | .820 | ||
NGANHANG4 | .816 | ||
NGANHANG2 | .811 | ||
NGANHANG11 | .804 | ||
NGANHANG8 | .749 | ||
NGANHANG5 | .728 | ||
NGANHANG1 | .723 | ||
VIMO5 | .870 | ||
VIMO6 | .861 | ||
VIMO4 | .832 | ||
VIMO2 | .744 | .279 | |
VIMO3 | .712 | .357 | |
KHACHHANG3 | .888 | ||
KHACHHANG2 | .214 | .839 | |
KHACHHANG1 | .253 | .795 | |
KHACHHANG5 | .775 |
Extraction Method: Principal Component Analysis. Rotation Method: Varimax with Kaiser Normalization.
a. Rotation converged in 5 iterations.
Bảng số 7: Phân tích nhân tố các thành phần nợ xấu
Kaiser-Meyer-Olkin Measure of Sampling Adequacy. | .679 | |
Bartlett's Test of Sphericity | Approx. Chi-Square | 110.417 |
df | 3 | |
Sig. | .000 | |
Bảng số 7b: Total Variance Explained
Initial Eigenvalues | Extraction Sums of Squared Loadings | |||||
Total | % of Variance | Cumulative % | Total | % of Variance | Cumulative % | |
1 | 1.913 | 63.775 | 63.775 | 1.913 | 63.775 | 63.775 |
2 | .555 | 18.516 | 82.291 | |||
3 | .531 | 17.709 | 100.000 |
Extraction Method: Principal Component Analysis.
Bảng số 7c: Component Matrixa
Component | |
1 | |
NOXAU1 | .806 |
NOXAU3 | .796 |
NOXAU2 | .794 |
Extraction Method: Principal Component Analysis.
a. 1 components extracted.
Bảng số 8: Ma trận các hệ số tương quan Pearson
Correlations
NOXAU | NGANHANG | VIMO | KHACHHANG | ||
NOXAU | Pearson Correlation | 1 | .566** | .559** | .556** |
Sig. (2-tailed) | .000 | .000 | .000 | ||
N | 196 | 196 | 196 | 196 | |
NGANHANG | Pearson Correlation | .566** | 1 | .316** | .336** |
Sig. (2-tailed) | .000 | .000 | .000 | ||
N | 196 | 196 | 196 | 196 | |
VIMO | Pearson Correlation | .559** | .316** | 1 | .369** |
Sig. (2-tailed) | .000 | .000 | .000 | ||
N | 196 | 196 | 196 | 196 | |
KHACHHANG | Pearson Correlation | .556** | .336** | .369** | 1 |
Sig. (2-tailed) | .000 | .000 | .000 | ||
N | 196 | 196 | 196 | 196 |
**. Correlation is significant at the 0.01 level (2-tailed).
Bảng số 9: Kết quả phân tích hồi qui bội
Bảng số 9a: Model Summaryb
R | R Square | Adjusted R Square | Std. Error of the Estimate | Durbin-Watson | |
1 | .749a | .561 | .555 | .41221 | 1.937 |
a. Predictors: (Constant), KHACHHANG, NGANHANG, VIMO
b. Dependent Variable: NOXAU
Bảng số 9b: ANOVAb
Sum of Squares | df | Mean Square | F | Sig. | |||
1 | Regression | 41.755 | 3 | 13.918 | 81.912 | .000a | |
Residual | 32.624 | 192 | .170 | ||||
Total | 74.379 | 195 | |||||
a. Predictors: (Constant), KHACHHANG, NGANHANG, VIMO
Bảng số 9b: ANOVAb
Sum of Squares | df | Mean Square | F | Sig. | |||
1 | Regression | 41.755 | 3 | 13.918 | 81.912 | .000a | |
Residual | 32.624 | 192 | .170 | ||||
Total | 74.379 | 195 | |||||
b. Dependent Variable: NOXAU
Bảng số 9c: Coefficientsa
Unstandardized Coefficients | Standardized Coefficients | t | Sig. | Collinearity Statistics | ||||
B | Std. Error | Beta | Tolerance | VIF | ||||
1 | (Constant) | .280 | .227 | 1.232 | .220 | |||
NGANHANG | .325 | .047 | .356 | 6.853 | .000 | .845 | 1.184 | |
VIMO | .364 | .058 | .330 | 6.263 | .000 | .822 | 1.216 | |
KHACHHANG | .233 | .039 | .315 | 5.930 | .000 | .811 | 1.234 |
a. Dependent Variable: NOXAU
Bảng số 10: Ma trận tương quan Spearman giữa phần dư với các biến độc lập
Correlations
ABS1 | NGANHAN G | VIMO | KHACHHAN G | |||
Spearman' s rho | ABS1 | Correlation Coefficient | 1.000 | -.132 | -.028 | -.086 |
Sig. (2-tailed) | . | .065 | .700 | .231 | ||
N | 196 | 196 | 196 | 196 | ||
NGANHANG | Correlation Coefficient | -.132 | 1.000 | .280** | .347** | |
Sig. (2-tailed) | .065 | . | .000 | .000 | ||
N | 196 | 196 | 196 | 196 | ||
VIMO | Correlation Coefficient | -.028 | .280** | 1.000 | .379** | |
Sig. (2-tailed) | .700 | .000 | . | .000 | ||
N | 196 | 196 | 196 | 196 | ||
KHACHHAN G | Correlation Coefficient | -.086 | .347** | .379** | 1.000 | |
Sig. (2-tailed) | .231 | .000 | .000 | . | ||
N | 196 | 196 | 196 | 196 |
**. Correlation is significant at the 0.01 level (2- tailed).
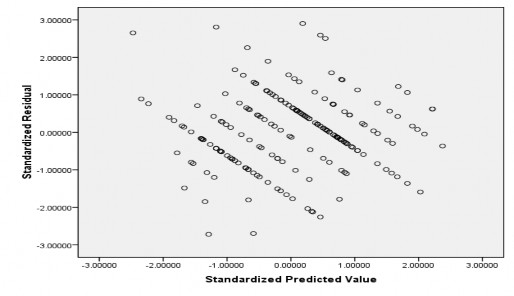
HÌNH 1: ĐỒ THỊ PHÂN TÁN PHẦN DƯ
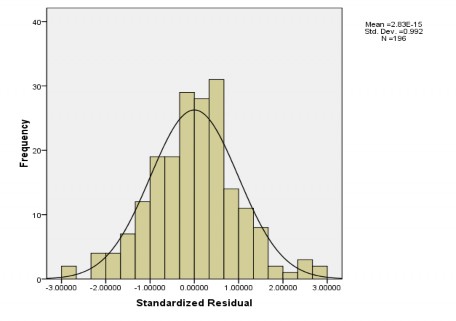
HÌNH 2: BIỂU ĐỒ TẦN SỐ HISTOGRAM