Total Variance Explained
Initial Eigenvalues | Extraction Sums of Squared Loadings | Rotation Sums of Squared Loadings | |||||||
Total | % of Variance | Cumulative % | Total | % of Variance | Cumulative % | Total | % of Variance | Cumulative % | |
1 | 5.031 | 26.481 | 26.481 | 5.031 | 26.481 | 26.481 | 2.658 | 13.990 | 13.990 |
2 | 2.166 | 11.402 | 37.883 | 2.166 | 11.402 | 37.883 | 2.637 | 13.877 | 27.866 |
3 | 1.627 | 8.564 | 46.447 | 1.627 | 8.564 | 46.447 | 2.057 | 10.825 | 38.692 |
4 | 1.182 | 6.223 | 52.669 | 1.182 | 6.223 | 52.669 | 2.020 | 10.629 | 49.321 |
5 | 1.048 | 5.515 | 58.184 | 1.048 | 5.515 | 58.184 | 1.684 | 8.863 | 58.184 |
6 | .879 | 4.627 | 62.811 | ||||||
7 | .827 | 4.350 | 67.162 | ||||||
8 | .775 | 4.076 | 71.238 | ||||||
9 | .748 | 3.937 | 75.175 | ||||||
10 | .655 | 3.445 | 78.621 | ||||||
11 | .615 | 3.239 | 81.860 | ||||||
12 | .613 | 3.225 | 85.085 | ||||||
13 | .570 | 3.002 | 88.087 | ||||||
14 | .514 | 2.706 | 90.793 | ||||||
15 | .494 | 2.602 | 93.395 | ||||||
16 | .450 | 2.370 | 95.765 | ||||||
17 | .433 | 2.277 | 98.042 | ||||||
18 | .311 | 1.635 | 99.676 | ||||||
19 | .062 | .324 | 100.000 |
Có thể bạn quan tâm!
-

 Bảng Câu Hỏi Nghiên Cứu Định Lượng Phiếu Khảo Sát Về Sự Hài Lòng Đối Với Thẻ Tín Dụng Của
 -
 Đánh Giá Độ Tin Cậy Thang Đo Bằng Cronbach’S Alpha
 -
 Kết Quả Phân Tích Nhân Tố Khám Phá Efa Đối Với Các Nhân Tố Ảnh Hưởng Đến Sự Hài Lòng Của Khách Hàng
 -
 Các nhân tố ảnh hưởng đến sự hài lòng của khách hàng khu vực TPHCM đối với thẻ tín dụng của Ngân hàng TMCP Công Thương Việt Nam - 16
Xem toàn bộ 130 trang tài liệu này.
Extraction Method: Principal Component Analysis.
Component Matrixa
Component | |||||
1 | 2 | 3 | 4 | 5 | |
HANH3 | .768 | .134 | -.385 | .158 | .224 |
HANH5 | .737 | .142 | -.410 | .205 | .263 |
CLHV2 | .650 | .023 | -.095 | -.008 | -.355 |
CLHV4 | .635 | .185 | -.124 | .017 | -.495 |
CLHV3 | .628 | .117 | -.061 | -.019 | -.535 |
GDCX2 | .628 | -.193 | .188 | -.357 | .153 |
GDCX1 | .572 | -.169 | .154 | -.179 | .098 |
.558 | -.091 | .206 | -.228 | .061 | |
HANH4 | .556 | .096 | -.105 | .106 | .199 |
HANH1 | .551 | .197 | -.454 | .121 | .215 |
GDCX3 | .542 | -.273 | .232 | -.479 | .127 |
GDCX4 | .509 | -.119 | .239 | -.223 | .172 |
GC3 | .485 | -.204 | .392 | .313 | -.150 |
CLTB3 | .057 | .702 | .226 | .041 | .151 |
CLTB4 | .081 | .665 | .231 | .025 | .045 |
CLTB1 | .094 | .646 | .339 | -.066 | .023 |
CLTB2 | .043 | .557 | .362 | -.032 | -.005 |
GC2 | .172 | -.281 | .442 | .547 | .221 |
GC1 | .439 | -.294 | .391 | .439 | -.080 |
Extraction Method: Principal Component Analysis.
a. 5 components extracted.
Rotated Component Matrixa
Component | |||||
1 | 2 | 3 | 4 | 5 | |
HANH5 | .873 | .183 | .009 | .199 | .081 |
HANH3 | .844 | .232 | .012 | .244 | .071 |
HANH1 | .756 | .083 | .022 | .163 | -.072 |
HANH4 | .525 | .247 | .090 | .124 | .143 |
GDCX3 | .039 | .806 | -.084 | .097 | .012 |
GDCX2 | .179 | .750 | -.027 | .131 | .076 |
GDCX4 | .143 | .601 | .054 | .059 | .148 |
GDCX5 | .147 | .585 | .057 | .186 | .127 |
GDCX1 | .199 | .574 | -.032 | .158 | .163 |
CLTB3 | .129 | -.057 | .740 | -.046 | -.035 |
CLTB1 | -.014 | .055 | .734 | .062 | -.027 |
CLTB4 | .081 | -.048 | .702 | .051 | -.030 |
CLTB2 | -.078 | .029 | .659 | .048 | .023 |
CLHV3 | .185 | .194 | .065 | .786 | .070 |
CLHV4 | .268 | .144 | .100 | .771 | .043 |
CLHV2 | .280 | .258 | -.015 | .635 | .098 |
GC2 | .048 | .054 | -.021 | -.194 | .780 |
GC1 | .065 | .188 | -.067 | .199 | .740 |
GC3 | .041 | .252 | .011 | .292 | .632 |
Extraction Method: Principal Component Analysis. Rotation Method: Varimax with Kaiser Normalization.
a. Rotation converged in 5 iterations.
Component Transformation Matrix
1 | 2 | 3 | 4 | 5 | |
1 | .584 | .588 | .064 | .488 | .267 |
2 | .210 | -.266 | .884 | .118 | -.300 |
3 | -.576 | .369 | .454 | -.121 | .558 |
4 | .298 | -.620 | -.011 | -.004 | .725 |
5 | .441 | .250 | .094 | -.856 | .028 |
Extraction Method: Principal Component Analysis. Rotation Method: Varimax with Kaiser Normalization.
2. Kết quả phân tích nhân tố khám phá EFA đối với thang đo sự hài lòng của khách hàng
KMO and Bartlett's Test
.745 | |
Approx. Chi-Square | 1492.652 |
Bartlett's Test of Sphericity df | 6 |
Sig. | .000 |
Communalities
Initial | Extraction | |
HL1 | 1.000 | .573 |
HL2 | 1.000 | .900 |
HL3 | 1.000 | .706 |
HL4 | 1.000 | .941 |
Extraction Method: Principal Component Analysis.
Total Variance Explained
Initial | Eigenvalues | Extraction Sums of Squared Loadings | ||||
Total | % of Variance | Cumulative % | Total | % of Variance | Cumulative % | |
1 | 3.121 | 78.015 | 78.015 | 3.121 | 78.015 | 78.015 |
2 | .566 | 14.155 | 92.170 | |||
3 | .275 | 6.882 | 99.052 | |||
4 | .038 | .948 | 100.000 |
Extraction Method: Principal Component Analysis.
Component Matrixa
Component | |
1 | |
HL4 | .970 |
HL2 | .949 |
HL3 | .840 |
HL1 | .757 |
Extraction Method: Principal Component Analysis.
a. 1 components extracted.
Rotated Component Matrixa
a. Only one component was extracted. The solution cannot be rotated.
PHỤ LỤC 06: KẾT QUẢ PHÂN TÍCH HỒI QUY
Descriptive Statistics
Mean | Std. Deviation | N | |
SHL | 3.4092 | .58221 | 377 |
F1_CLHV | 3.3484 | .68637 | 377 |
F2_CLTB | 3.2500 | .63424 | 377 |
F3_GDCX | 3.6021 | .52713 | 377 |
F4_GC | 3.7569 | .52604 | 377 |
F5_HANH | 3.7301 | .55658 | 377 |
Correlations
SHL | F1_ CLHV | F2_ CLTB | F3_ GDCX | F4_ GC | F5_ HANH | ||
SHL | 1.000 | .426 | .257 | .438 | .358 | .338 | |
F1_CLHV | .426 | 1.000 | .108 | .466 | .261 | .537 | |
Pearson Correlatio n | F2_CLTB F3_GDCX | .257 .438 | .108 .466 | 1.000 -.006 | -.006 1.000 | -.050 .384 | .088 .452 |
F4_GC | .358 | .261 | -.050 | .384 | 1.000 | .217 | |
F5_HANH | .338 | .537 | .088 | .452 | .217 | 1.000 | |
SHL | . | .000 | .000 | .000 | .000 | .000 | |
F1_CLHV | .000 | . | .018 | .000 | .000 | .000 | |
Sig. (1- | F2_CLTB | .000 | .018 | . | .454 | .164 | .044 |
tailed) | F3_GDCX | .000 | .000 | .454 | . | .000 | .000 |
F4_GC | .000 | .000 | .164 | .000 | . | .000 | |
F5_HANH | .000 | .000 | .044 | .000 | .000 | . | |
SHL | 377 | 377 | 377 | 377 | 377 | 377 | |
F1_CLHV | 377 | 377 | 377 | 377 | 377 | 377 | |
N | F2_CLTB F3_GDCX | 377 377 | 377 377 | 377 377 | 377 377 | 377 377 | 377 377 |
F4_GC | 377 | 377 | 377 | 377 | 377 | 377 | |
F5_HANH | 377 | 377 | 377 | 377 | 377 | 377 |
Variables Entered/Removeda
Variables Entered | Variables Removed | Method | |
1 | F5_HANH, F2_CLTB, F4_GC, F3_GDCX, F1_CLHVb | . | Enter |
a. Dependent Variable: SHL
b. All requested variables entered.
Model Summaryb
R | R Square | Adjusted R Square | Std. Error of the Estimate | Durbin-Watson | |
1 | .590a | .348 | .339 | .47332 | 2.016 |
a. Predictors: (Constant), F5_HANH, F2_CLTB, F4_GC, F3_GDCX, F1_CLHV
b. Dependent Variable: SHL
ANOVAa
Sum of Squares | df | Mean Square | F | Sig. | ||
Regression | 44.337 | 5 | 8.867 | 39.582 | .000b | |
1 | Residual | 83.114 | 371 | .224 | ||
Total | 127.451 | 376 |
a. Dependent Variable: SHL
b. Predictors: (Constant), F5_HANH, F2_CLTB, F4_GC, F3_GDCX, F1_CLHV
Coefficientsa
Unstandardized Coefficients | Standardized Coefficients | t | Sig. | Correlations | Collinearity | Statistics | |||||
B | Std. Error | Beta | Zero- order | Partial | Part | Tolerance | VIF | ||||
(Constant) | .064 | .258 | .249 | .804 | |||||||
F1_CLHV | .174 | .045 | .205 | 3.900 | .000 | .426 | .198 | .164 | .638 | 1.568 | |
1 | F2_CLTB F3_GDCX | .223 .263 | .039 .057 | .242 .238 | 5.716 4.612 | .000 .000 | .257 .438 | .285 .233 | .240 .193 | .977 .661 | 1.024 1.513 |
F4_GC | .236 | .051 | .213 | 4.664 | .000 | .358 | .235 | .196 | .840 | 1.191 | |
F5_HANH | .055 | .054 | .053 | 1.024 | .306 | .338 | .053 | .043 | .658 | 1.521 |
a. Dependent Variable: SHL
Collinearity Diagnosticsa
Dimension | Eigenvalue | Condition Index | Variance Proportions | ||||||
(Constant) | F1_ CLHV | F2_ CLTB | F3_ GDCX | F4_ GC | F5_ HANH | ||||
1 | 5.905 | 1.000 | .00 | .00 | .00 | .00 | .00 | .00 | |
2 | .039 | 12.298 | .00 | .10 | .66 | .02 | .01 | .01 | |
1 | 3 4 | .025 .013 | 15.451 21.012 | .03 .01 | .50 .33 | .08 .02 | .02 .04 | .21 .32 | .01 .54 |
5 | .011 | 23.560 | .02 | .00 | .03 | .88 | .14 | .27 | |
6 | .007 | 29.639 | .95 | .06 | .21 | .03 | .32 | .17 |
a. Dependent Variable: SHL
Residuals Statisticsa
Minimum | Maximum | Mean | Std. Deviation | N | |
Predicted Value | 2.2911 | 4.4328 | 3.4092 | .34339 | 377 |
Residual | -1.18156 | 1.84422 | .00000 | .47016 | 377 |
Std. Predicted Value | -3.256 | 2.981 | .000 | 1.000 | 377 |
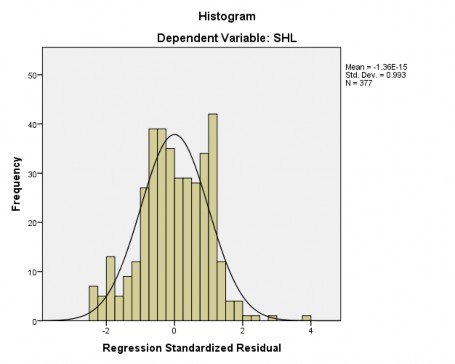
Std. Residual | -2.496 | 3.896 | .000 | .993 | 377 |
a. Dependent Variable: SHL