PHỤ LỤC 4: KẾT QUẢ PHÂN TÍCH CRONBACH ALPHA
Reliability Statistics
Cronbach's Alpha Based on Standardized Items | N of Items | |
.859 | .857 | 4 |
Có thể bạn quan tâm!
-
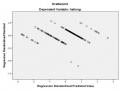
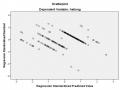
 Giả Định Liên Hệ Tuyến Tính Và Phương Sai Bằng Nhau
 -
 Tăng Cường Chất Lượng Thông Tin Sản Phẩm/dịch Vụ
 -
 Davis, D. Fred, And Arbor, Ann. (1989), Perceived Usefulness, Perceived Ease Of Use, And User Acceptance Of Information Technology. Mis Quarterly September 1989.
 -
 Các nhân tố ảnh hưởng đến sự hài lòng của khách hàng khi mua sắm trực tuyến - 12
Xem toàn bộ 102 trang tài liệu này.

Scale Mean if Item Deleted | Scale Variance if Item Deleted | Corrected Item- Total Correlation | Cronbach's Alpha if Item Deleted | |
DEDANG1 | 13.20 | 2.123 | .472 | .908 |
DEDANG2 | 13.34 | 1.787 | .728 | .810 |
DEDANG3 | 13.27 | 1.697 | .820 | .771 |
DEDANG4 | 13.33 | 1.651 | .819 | .769 |
Reliability Statistics
Cronbach's Alpha Based on Standardized Items | N of Items | |
.800 | .780 | 4 |
Scale Mean if Item Deleted | Scale Variance if Item Deleted | Corrected Item- Total Correlation | Cronbach's Alpha if Item Deleted | |
HANGHOA1 | 10.98 | 4.281 | .292 | .870 |
HANGHOA2 | 11.30 | 2.697 | .753 | .673 |
HANGHOA3 | 11.21 | 3.338 | .584 | .763 |
HANGHOA4 | 11.36 | 2.270 | .875 | .594 |
Reliability Statistics
Cronbach's Alpha Based on Standardized Items | N of Items | |
.925 | .926 | 6 |
Scale Mean if Item Deleted | Scale Variance if Item Deleted | Corrected Item- Total Correlation | Cronbach's Alpha if Item Deleted | |
CAUTRUC1 | 19.84 | 4.747 | .714 | .921 |
CAUTRUC2 | 19.96 | 4.714 | .829 | .906 |
CAUTRUC3 | 19.95 | 4.665 | .823 | .906 |
CAUTRUC4 | 19.95 | 4.997 | .750 | .916 |
CAUTRUC5 | 20.05 | 4.622 | .794 | .910 |
CAUTRUC6 | 20.05 | 4.630 | .804 | .909 |
Reliability Statistics
Cronbach's Alpha Based on Standardized Items | N of Items | |
.905 | .908 | 4 |
Scale Mean if Item Deleted | Scale Variance if Item Deleted | Corrected Item- Total Correlation | Cronbach's Alpha if Item Deleted | |
ANTOAN1 | 11.56 | 1.763 | .780 | .884 |
ANTOAN2 | 11.40 | 2.062 | .785 | .882 |
ANTOAN3 | 11.48 | 1.782 | .871 | .846 |
ANTOAN4 | 11.49 | 2.001 | .733 | .896 |
Reliability Statistics
Cronbach's Alpha Based on Standardized Items | N of Items | |
.854 | .858 | 5 |
Scale Mean if Item Deleted | Scale Variance if Item Deleted | Corrected Item- Total Correlation | Cronbach's Alpha if Item Deleted | |
DICHVU1 | 16.37 | 2.686 | .717 | .811 |
DICHVU2 | 16.40 | 2.982 | .765 | .804 |
DICHVU3 | 16.01 | 2.941 | .596 | .844 |
DICHVU4 | 16.33 | 2.934 | .662 | .826 |
DICHVU5 | 16.00 | 3.035 | .625 | .835 |
Reliability Statistics
Cronbach's Alpha Based on Standardized Items | N of Items | |
.757 | .757 | 4 |
Item-Total Statistics
Scale Mean if Item Deleted | Scale Variance if Item Deleted | Corrected Item- Total Correlation | Squared Multiple Correlation | Cronbach's Alpha if Item Deleted | |
HAILONG1 | 11.25 | 1.362 | .415 | .424 | .768 |
HAILONG2 | 11.33 | 1.057 | .551 | .561 | .708 |
HAILONG3 | 11.33 | 1.106 | .621 | .475 | .664 |
HAILONG4 | 11.34 | 1.093 | .649 | .523 | .648 |
PHỤ LỤC 5: KẾT QUẢ PHÂN TÍCH NHÂN TỐ EFA
KMO and Bartlett's Test
.852 | ||
Bartlett's Test of Sphericity | Approx. Chi-Square | 4889.021 |
df | 253 | |
Sig. | .000 |
Total Variance Explained
Initial Eigenvalues | Extraction Sums of Squared Loadings | Rotation Sums of Squared Loadings | |||||||
Total | % of Variance | Cumulative % | Total | % of Variance | Cumulative % | Total | % of Variance | Cumulative % | |
1 | 8.687 | 37.769 | 37.769 | 8.687 | 37.769 | 37.769 | 4.499 | 19.562 | 19.562 |
2 | 2.594 | 11.280 | 49.049 | 2.594 | 11.280 | 49.049 | 3.355 | 14.589 | 34.151 |
3 | 2.166 | 9.417 | 58.466 | 2.166 | 9.417 | 58.466 | 2.988 | 12.991 | 47.141 |
4 | 1.751 | 7.613 | 66.079 | 1.751 | 7.613 | 66.079 | 2.964 | 12.885 | 60.027 |
5 | 1.172 | 5.096 | 71.175 | 1.172 | 5.096 | 71.175 | 2.564 | 11.149 | 71.175 |
6 | .915 | 3.979 | 75.154 | ||||||
7 | .843 | 3.664 | 78.818 | ||||||
8 | .708 | 3.077 | 81.895 | ||||||
9 | .650 | 2.825 | 84.720 | ||||||
10 | .531 | 2.307 | 87.027 | ||||||
11 | .470 | 2.042 | 89.069 | ||||||
12 | .424 | 1.842 | 90.911 | ||||||
13 | .365 | 1.588 | 92.499 | ||||||
14 | .315 | 1.370 | 93.869 | ||||||
15 | .271 | 1.179 | 95.048 | ||||||
16 | .260 | 1.131 | 96.180 | ||||||
17 | .196 | .852 | 97.032 | ||||||
18 | .184 | .799 | 97.831 | ||||||
19 | .142 | .617 | 98.448 | ||||||
20 | .140 | .608 | 99.056 | ||||||
21 | .104 | .452 | 99.508 | ||||||
22 | .102 | .442 | 99.950 | ||||||
23 | .011 | .050 | 100.000 |
Extraction Method: Principal Component Analysis.
Rotated Component Matrixa
Component | |||||
1 | 2 | 3 | 4 | 5 | |
DEDANG1 | .517 | ||||
DEDANG2 | .836 | ||||
DEDANG3 | .871 | ||||
DEDANG4 | .880 | ||||
HANGHOA1 | .451 | ||||
HANGHOA2 | .885 | ||||
HANGHOA3 | .779 | ||||
HANGHOA4 | .948 | ||||
CAUTRUC1 | .697 | ||||
CAUTRUC2 | .815 | ||||
CAUTRUC3 | .821 | ||||
CAUTRUC4 | .768 | ||||
CAUTRUC5 | .843 | ||||
CAUTRUC6 | .853 | ||||
ANTOAN1 | .738 | ||||
ANTOAN2 | .780 | ||||
ANTOAN3 | .779 | ||||
ANTOAN4 | .723 | ||||
DICHVU1 | .668 | ||||
DICHVU2 | .671 | ||||
DICHVU3 | .808 | ||||
DICHVU4 | .612 | ||||
DICHVU5 | .782 |
Extraction Method: Principal Component Analysis. Rotation Method: Varimax with Kaiser Normalization.
a. Rotation converged in 6 iterations.
CỦA KHÁCH HÀNG
KMO and Bartlett's Test
.503 | ||
Bartlett's Test of Sphericity | Approx. Chi-Square | 351.265 |
df | 6 | |
Sig. | .000 |
Total Variance Explained
Initial Eigenvalues | Extraction Sums of Squared Loadings | |||||
Total | % of Variance | Cumulative % | Total | % of Variance | Cumulative % | |
1 | 2.330 | 58.244 | 58.244 | 2.330 | 58.244 | 58.244 |
2 | .888 | 22.189 | 80.433 | |||
3 | .570 | 14.252 | 94.685 | |||
4 | .213 | 5.315 | 100.000 |
Extraction Method: Principal Component Analysis.
Component Matrixa
Component | |
1 | |
HAILONG1 | .644 |
HAILONG2 | .767 |
HAILONG3 | .805 |
HAILONG4 | .824 |
Extraction Method: Principal Component Analysis.
a. 1 components extracted.
Correlations
hailong | cautructra ngweb | antoan | dichvukhach hang | thuantien | hanghoa | ||
Pearson Correlation | hailong | 1.000 | .557 | .675 | .585 | .533 | .386 |
cautructrangweb | .557 | 1.000 | .588 | .434 | .477 | .092 | |
antoan | .675 | .588 | 1.000 | .610 | .522 | .072 | |
dichvukhachhang | .585 | .434 | .610 | 1.000 | .400 | .019 | |
thuantien | .533 | .477 | .522 | .400 | 1.000 | .002 | |
hanghoa | .386 | .092 | .072 | .019 | .002 | 1.000 | |
Sig. (1-tailed) | hailong | . | .000 | .000 | .000 | .000 | .000 |
cautructrangweb | .000 | . | .000 | .000 | .000 | .031 | |
antoan | .000 | .000 | . | .000 | .000 | .026 | |
dichvukhachhang | .000 | .000 | .000 | . | .000 | .000 | |
thuantien | .000 | .000 | .000 | .000 | . | .043 | |
hanghoa | .000 | .071 | .126 | .380 | .489 | . | |
N | hailong | 257 | 257 | 257 | 257 | 257 | 257 |
cautructrangweb | 257 | 257 | 257 | 257 | 257 | 257 | |
antoan | 257 | 257 | 257 | 257 | 257 | 257 | |
dichvukhachhang | 257 | 257 | 257 | 257 | 257 | 257 | |
thuantien | 257 | 257 | 257 | 257 | 257 | 257 | |
hanghoa | 257 | 257 | 257 | 257 | 257 | 257 |
Variables Entered/Removeda
Variables Entered | Variables Removed | Method | |
1 | hanghoa, thuantien, dichvukhachhang, cautructrangweb, antoanb | . | Enter |
a. Dependent Variable: hailong
b. All requested variables entered.
Model Summaryb
R | R Square | Adjusted R Square | Std. Error of the Estimate | Durbin-Watson | |
1 | .822a | .675 | .669 | .19826 | 1.607 |
a. Predictors: (Constant), hanghoa, thuantien, dichvukhachhang, cautructrangweb, antoan
b. Dependent Variable: hailong
ANOVAa
Sum of Squares | df | Mean Square | F | Sig. | ||
1 | Regression | 20.516 | 5 | 4.103 | 104.384 | .000b |
Residual | 9.866 | 251 | .039 | |||
Total | 30.382 | 256 |
a. Dependent Variable: hailong
b. Predictors: (Constant), hanghoa, thuantien, dichvukhachhang, cautructrangweb, antoan
Coefficientsa
Unstandardized Coefficients | Standardized Coefficients | t | Sig. | Collinearity Statistics | ||||
B | Std. Error | Beta | Tolerance | VIF | ||||
1 | (Constant) | .106 | .171 | .618 | .537 | |||
cautructrangweb | .108 | .037 | .136 | 2.937 | .004 | .606 | 1.651 | |
antoan | .237 | .040 | .311 | 5.883 | .000 | .463 | 2.159 | |
dichvukhachhang | .203 | .038 | .247 | 5.374 | .000 | .613 | 1.631 | |
thuantien | .163 | .034 | .208 | 4.755 | .000 | .674 | 1.483 | |
hanghoa | .209 | .022 | .347 | 9.586 | .000 | .986 | 1.014 |
a. Dependent Variable: hailong