Component Matrixa
Component | |
1 | |
CLTT4 | .903 |
CLTT15 | .883 |
CLTT17 | .881 |
CLTT6 | .876 |
CLTT2 | .874 |
CLTT11 | .871 |
CLTT12 | .870 |
CLTT18 | .868 |
CLTT14 | .865 |
CLTT20 | .864 |
CLTT16 | .859 |
CLTT9 | .853 |
CLTT7 | .847 |
CLTT8 | .847 |
CLTT13 | .847 |
CLTT1 | .836 |
CLTT19 | .833 |
CLTT5 | .832 |
CLTT10 | .830 |
CLTT3 | .805 |
Có thể bạn quan tâm!
-

 Tarus, M.j., Và Cộng Sự , 2015. Determinants Of Accurate Financial Statements Reporting In Listed Banks In Kenya; A Survey Of Commercial Banks In Nakura Town. Iosr Journal Of Business And
 -
 Các nhân tố ảnh hưởng đến chất lượng thông tin trên báo cáo tài chính của các ngân hàng thương mại tại Việt Nam - 13
 -
 Các nhân tố ảnh hưởng đến chất lượng thông tin trên báo cáo tài chính của các ngân hàng thương mại tại Việt Nam - 14
Xem toàn bộ 128 trang tài liệu này.
Extraction Method: Principal Component Analysis.
a.1 components extracted.
PHỤ LỤC 7
PHÂN TÍCH HỒI QUY TUYẾN TÍNH ĐA BIẾN
Variables Entered/Removedb
Variables Entered | Variables Removed | Method | |
1 | THUE, KSNB, DTNV, NLNV, CLPM, QTNHa | . | Enter |
a. All requested variables entered.
b. Dependent Variable: CLTT
Model Summaryb
R | R Square | Adjusted R Square | Std. Error of the Estimate | Durbin-Watson | |
1 | .729a | .531 | .519 | .5096136 | 2.104 |
ANOVAb
Sum of Squares | df | Mean Square | F | Sig. | ||
1 | Regression | 65.695 | 6 | 10.949 | 42.160 | .000a |
Residual | 57.914 | 223 | .260 | |||
Total | 123.609 | 229 |
a. Predictors: (Constant), THUE, KSNB, DTNV, NLNV, CLPM, QTNH
b. Dependent Variable: CLTT
Model | Unstandardized Coefficients | Standardized Coefficients | t | Sig. | Collinearity Statistics | |||
B | Std. Error | Beta | Tolerance | VIF | ||||
(Constant) | .495 | .319 | 1.550 | .123 | ||||
QTNH | .169 | .035 | .242 | 4.772 | .000 | .818 | 1.222 | |
KSNB | .050 | .030 | .077 | 1.673 | .096 | .993 | 1.007 | |
1 | CLPM | .213 | .051 | .205 | 4.157 | .000 | .865 | 1.156 |
DTNV | .343 | .053 | .340 | 6.522 | .000 | .773 | 1.294 | |
NLNV | .200 | .052 | .191 | 3.865 | .000 | .860 | 1.163 | |
THUE | -.157 | .040 | -.185 | -3.905 | .000 | .939 | 1.064 | |
a. Dependent Variable: CLTT | ||||||||
Collinearity Diagnosticsa
Eigenvalue | Condition Index | Variance Proportions | |||||
Model | Dimension | (Constant) | QTNH | KSNB | CLPM | ||
1 | 1 | 6.705 | 1.000 | .00 | .00 | .00 | .00 |
2 | .099 | 8.243 | .00 | .11 | .63 | .01 | |
3 | .076 | 9.423 | .00 | .05 | .28 | .02 | |
4 | .047 | 11.937 | .00 | .45 | .03 | .52 | |
5 | .037 | 13.403 | .00 | .38 | .00 | .15 | |
6 | .027 | 15.659 | .01 | .00 | .01 | .06 | |
7 | .009 | 27.397 | .98 | .01 | .04 | .23 |
Collinearity Diagnosticsa
Variance Proportions | ||||
Model | Dimension | DTNV | NLNV | THUE |
1 | 1 | .00 | .00 | .00 |
2 | .03 | .01 | .04 | |
3 | .00 | .00 | .48 | |
4 | .01 | .01 | .01 | |
5 | .16 | .32 | .09 | |
6 | .80 | .34 | .03 | |
7 | .01 | .32 | .36 |
a. Dependent Variable: CLTT
Residuals Statisticsa
Minimum | Maximum | Mean | Std. Deviation | N | |
Predicted Value | 1.753267 | 4.644257 | 3.279565 | .5356077 | 230 |
Residual | -1.0251405 | 1.7369101 | .0000000 | .5028931 | 230 |
Std. Predicted Value | -2.850 | 2.548 | .000 | 1.000 | 230 |
Std. Residual | -2.012 | 3.408 | .000 | .987 | 230 |
a. Dependent Variable: CLTT
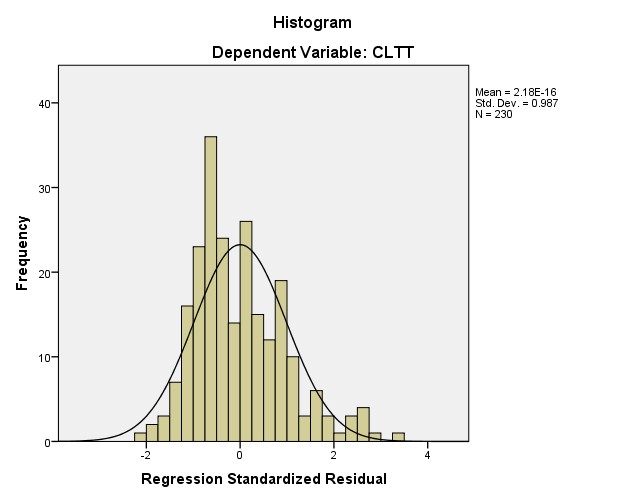
Charts
Correlations
QTNH | KSNB | CLPM | DTNV | |||
Spearman's rho | QTNH | Correlation Coefficient | 1.000 | .052 | .208** | .380** |
Sig. (2-tailed) | . | .429 | .002 | .000 | ||
N | 230 | 230 | 230 | 230 | ||
KSNB | Correlation Coefficient | .052 | 1.000 | .141* | .087 | |
Sig. (2-tailed) | .429 | . | .033 | .189 | ||
N | 230 | 230 | 230 | 230 | ||
CLPM | Correlation Coefficient | .208** | .141* | 1.000 | .215** | |
Sig. (2-tailed) | .002 | .033 | . | .001 | ||
N | 230 | 230 | 230 | 230 | ||
DTNV | Correlation Coefficient | .380** | .087 | .215** | 1.000 | |
Sig. (2-tailed) | .000 | .189 | .001 | . | ||
N | 230 | 230 | 230 | 230 | ||
NLNV | Correlation Coefficient | .264** | .014 | .034 | .296** | |
Sig. (2-tailed) | .000 | .830 | .611 | .000 | ||
N | 230 | 230 | 230 | 230 | ||
THUE | Correlation Coefficient | -.109 | .044 | -.196** | -.119 | |
Sig. (2-tailed) | .099 | .510 | .003 | .072 | ||
N | 230 | 230 | 230 | 230 | ||
ABSRES | Correlation Coefficient | .080 | .022 | .107 | -.036 | |
Sig. (2-tailed) | .226 | .737 | .107 | .583 | ||
N | 230 | 230 | 230 | 230 |
Correlations
NLNV | THUE | ABSRES | |||
Spearman's rho | QTNH | Correlation Coefficient | .264** | -.109 | .080 |
Sig. (2-tailed) | .000 | .099 | .226 | ||
N | 230 | 230 | 230 | ||
KSNB | Correlation Coefficient | .014 | .044 | .022 | |
Sig. (2-tailed) | .830 | .510 | .737 | ||
N | 230 | 230 | 230 | ||
CLPM | Correlation Coefficient | .034 | -.196** | .107 | |
Sig. (2-tailed) | .611 | .003 | .107 | ||
N | 230 | 230 | 230 | ||
DTNV | Correlation Coefficient | .296** | -.119 | -.036 | |
Sig. (2-tailed) | .000 | .072 | .583 | ||
N | 230 | 230 | 230 | ||
NLNV | Correlation Coefficient | 1.000 | -.140* | .065 | |
Sig. (2-tailed) | . | .033 | .325 | ||
N | 230 | 230 | 230 | ||
THUE | Correlation Coefficient | -.140* | 1.000 | -.075 | |
Sig. (2-tailed) | .033 | . | .259 | ||
N | 230 | 230 | 230 | ||
ABSRES | Correlation Coefficient | .065 | -.075 | 1.000 | |
Sig. (2-tailed) | .325 | .259 | . | ||
N | 230 | 230 | 230 |