Total Variance Explained
Initial Eigenvalues | Extraction Sums of Squared Loadings | |||||
Total | % of Variance | Cumulative % | Total | % of Variance | Cumulative % | |
1 | 2,958 | 73,951 | 73,951 | 2,958 | 73,951 | 73,951 |
2 | ,412 | 10,290 | 84,241 | |||
3 | ,348 | 8,707 | 92,948 | |||
4 | ,282 | 7,052 | 100,000 |
Có thể bạn quan tâm!
-

 Ảnh hưởng của chất lượng dịch vụ ngân hàng trực tuyến của ngân hàng đầu tư và phát triển Việt Nam đến sự thỏa mãn của khách hàng tại thị trường TP.Hồ Chí Minh - 14
 -
 Thang Đo Chất Lượng Dịch Vụ Khách Hàng Trực Tuyến
 -
 Kết Quả Kiểm Định Biến Kmo Và Barlett Của Ba Thang Đo Biến Độc Lập Đối Với Chất Lượng Dịch Vụ Internet Banking Tổng Quát
 -
 Ảnh hưởng của chất lượng dịch vụ ngân hàng trực tuyến của ngân hàng đầu tư và phát triển Việt Nam đến sự thỏa mãn của khách hàng tại thị trường TP.Hồ Chí Minh - 18
Xem toàn bộ 149 trang tài liệu này.
Extraction Method: Principal Component Analysis.
Component Matrixa
Component | |
1 | |
SAS1 | ,885 |
SAS2 | ,875 |
SAS4 | ,846 |
SAS3 | ,832 |
PHỤ LỤC 7
PHÂN TÍCH HỒI QUY
1. Ma trận hệ số tương quan giữa các yếu tố tạo nên chất lượng dịch vụ internet banking tổng quát
Correlations
SIB | SMI | SCO | SPB | ||
Pearson Correlation | SIB | 1.000 | .693 | .753 | .577 |
SMI | .693 | 1.000 | .390 | .305 | |
SCO | .753 | .390 | 1.000 | .387 | |
SPB | .577 | .305 | .387 | 1.000 | |
Sig. (1-tailed) | SIB | . | .000 | .000 | .000 |
SMI | .000 | . | .000 | .000 | |
SCO | .000 | .000 | . | .000 | |
SPB | .000 | .000 | .000 | . | |
N | SIB | 240 | 240 | 240 | 240 |
SMI | 240 | 240 | 240 | 240 | |
SCO | 240 | 240 | 240 | 240 | |
SPB | 240 | 240 | 240 | 240 |
Model Summaryb
R | R Square | Adjusted R Square | Std. Error of the Estimate | Change Statistics | |||||
R Square Change | F Change | df1 | df2 | Sig. F Change | |||||
1 | .900a | .810 | .807 | .30545 | .810 | 334.420 | 3 | 236 | .000 |
a. Predictors: (Constant), SPB, SMI, SCO
b. Dependent Variable: SIB
ANOVAb
Sum of Squares | df | Mean Square | F | Sig. | ||
1 | Regression | 93.605 | 3 | 31.202 | 334.420 | .000a |
Residual | 22.019 | 236 | .093 | |||
Total | 115.624 | 239 |
a. Predictors: (Constant), SPB, SMI, SCO
b. Dependent Variable: SIB
2. Ma trận hệ số tương quan giữa chất lượng dịch vụ internet banking tổng quát với sự thỏa mãn của khách hàng
Correlations
SAS | SIB | ||
Pearson Correlation | SAS | 1.000 | .624 |
SIB | .624 | 1.000 | |
Sig. (1-tailed) | SAS | . | .000 |
SIB | .000 | . | |
N | SAS | 240 | 240 |
SIB | 240 | 240 |
Model Summaryb
R | R Square | Adjusted R Square | Std. Error of the Estimate | Change Statistics | |||||
R Square Change | F Change | df1 | df2 | Sig. F Change | |||||
1 | .624a | .389 | .386 | .75935 | .389 | 151.475 | 1 | 238 | .000 |
a. Predictors: (Constant), SIB
b. Dependent Variable: SAS
Coefficientsa
Unstandardized Coefficients | Standardized Coefficients | t | Sig. | Correlations | Collinearity Statistics | ||||||
B | Std. Error | Beta | Zero- order | Partial | Part | Tolerance | VIF | ||||
1 | (Constant) | .263 | .120 | 2.200 | .029 | ||||||
SMI | .369 | .027 | .424 | 13.508 | .000 | .693 | .660 | .384 | .820 | 1.219 | |
SCO | .420 | .028 | .487 | 15.034 | .000 | .753 | .699 | .427 | .769 | 1.301 | |
SPB | .249 | .030 | .259 | 8.270 | .000 | .577 | .474 | .235 | .822 | 1.217 |
a. Dependent Variable: SIB
Coefficientsa
Unstandardized Coefficients | Standardized Coefficients | t | Sig. | Correlations | Collinearity Statistics | ||||||
B | Std. Error | Beta | Zero- order | Partial | Part | Tolerance | VIF | ||||
1 | (Consta nt) | -.014 | .274 | .624 | -.051 | .960 | .624 | .624 | .624 | 1.000 | 1.000 |
SIB | .869 | .071 | 12.308 | .000 |
a. Dependent Variable: SAS
3. Biểu đồ phân tán giữa hai biến giá trị chuẩn hóa ( Standardized Predicted Value) và phần dư chuẩn hóa (Standardized Residual)
S catterplot
0
0
Regression Studentized Deleted
(Press) Residual
Dependent Variable: SIB
Regression Standardized Residual
Scatterplot
Regression Studentized Deleted (Press) Residual
Dependent Variable: SAS
Regression Standardized Residual
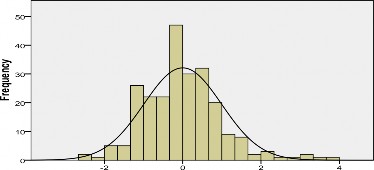
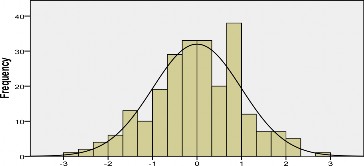
4. Biểu đồ Histogram
![]()
Dependent Variałøle: SIØ
![]()
![]()
![]()
![]()
![]()
![]()
5.Biểu đồ Normal P-P Plot
Normal P-P Plot of Regression Standardized Residual
Dependent Variable: SIB
Observed Cum Prob
Normal P-P Plot of Regression Standardized Residual
Dependent Variable: SAS
Observed Cum Prob
6. Kết quả kiểm định đa cộng tuyến
Coefficientsa
Unstandardized Coefficients | Standardize d Coefficients | t | Sig. | Correlations | Collinearity Statistics | ||||||
B | Std. Error | Beta | Zero- order | Partial | Part | Tolerance | VIF | ||||
1 | (Constant) | .263 | .120 | 2.200 | .029 | ||||||
SMI | .369 | .027 | .424 | 13.508 | .000 | .693 | .660 | .384 | .820 | 1.219 | |
SCO | .420 | .028 | .487 | 15.034 | .000 | .753 | .699 | .427 | .769 | 1.301 | |
SPB | .249 | .030 | .259 | 8.270 | .000 | .577 | .474 | .235 | .822 | 1.217 |
a. Dependent Variable: SIB
Coefficientsa
Unstandardized Coefficients | Standardize d Coefficients | t | Sig. | Correlations | Collinearity Statistics | ||||||
B | Std. Error | Beta | Zero- order | Partial | Part | Tolerance | VIF | ||||
1 | (Constant) | -.014 | .274 | .624 | -.051 | .960 | .624 | .624 | .624 | 1.000 | 1.000 |
SIB | .869 | .071 | 12.308 | .000 |
a. Dependent Variable: SAS