98. Stein, Kim S. W., Nielsen T. T. & Easter R. A. (2001). Standardized ileal protein and amino acid digestility by growing pig and sows. Journal of Animal Science. 79(8): 2113-2122.
99. Stein, Lagos L. V. & Casas G. A. (2016). Nutritional value of feed ingredients of plant origin fed to pigs. Animal Feed Science and Technology. 218: 33-69.
100. Stein, Pahm A. A. & Roth J. A. (2010). Feeding wheat to pigs. Swine Focus No
02. University of illinois, Urbana – USA.
101. Sulabo R. C., Tokach M. D., Jacela J. Y., Nelssen J. L., Dritz S. S., Derouchey J.
M. & Goodband R. D. (2008). Effects of lactation feed intake and creep feeding on sow and piglet performance. J. Anim. Sci. 85(Suppl. 2): 197.
102. Tokach M., Goodband B. & Derouchey J. M. (2011). Sorghum in swine production feeding guide. Sorgum Checkoff, Kansas State University - Manhattan, Kan - USA.
103. Ton That Son, Nguyen Thi Mai & Ton Nu Mai Anh (2008). The determination of Apparential metabolizable energy (AME) of some soybean and maize varieties for poultry by direct methods. Proceedings of The 13th Science Animal Congress of The Asian-Austalian Association of Animal Production Societies. Agricutural Publishing House. 247.
104. Trujillo H.A.J. (2009). Alternative feedstuffs for swine in Colombia: what are our options? Revista Colombiana de Ciencias Pecuarias. 22(3): 278-28.
105. USDA (2018). World Markets and Trade.
106. USDA (2019). World Markets and Trade.
107. USDA (2020). World Markets and Trade.
108. Vicente B., Valencia D. G., Perez-Serrano M., Lazaro R. & Mateos G. G. (2008). The effects of feeding rice in substitution of corn and the degree of starch gelatinization of rice on the digestibility of dietary components and productive performance of young pigs. J.Anim.Sci. 86: 119-126.
109. Vicente B., Valencia D. G., Serrano M. P., Lazaro R. & Mateos G. G. (2009). Effects of feeding rice and the degree of starch gelatinization of rice on nutrient digestibility and ileal morphology of young pigs. British Journal of Nutrition. 101(9): 1278-1281.
110. Whittemore C. (1998). The science and practice of pig production. 485-512, 546-579.
111. Wu X. J. & Liu F. Y. (1986). Comparing experiment of feeding both polished rice and corn respectively to growing pigs. Feed Research, Beijing. (6): 22-23.
112. Yamamoto A., Yoshikawa T. & Murakami A. (2016). Effects of Brown Rice Particle Size on Growth Performance and Energy Digestibility in Finishing Pigs. Nihon Yoton Gakkaishi. 53: 143-146.
113. Yu M., Z. Li, T. Rong, G. Wang, Z. Liu, W. Chen, J. Li, Jianhao Li & Ma X. (2020). Different dietary starch sources alter the carcass traits, meat quality, and the profile of muscle amino acid and fatty acid in finishing pigs. Journal of Animal Science and Biotechnology. 11: 78-92.
114. Zhang, Li D., Piao X. S., Han I. K., Yang C. J., Shin I. S., Dai J. G. & Li J. B. (2002). Effects of Replacing Corn with Brown Rice or Brown Rice with Enzyme on Growth Performance and Nutrient Digestibility in Growing Pigs Asian-Aust. J. Anim. Sci. 15(9): 1334-1340.
115. Zhang, Tian K. X., Wang J. C., Huang M. H., Shen W. J. & Jin H. (1999). Comparison on feeding value between brown rice and corn basal diet in growing pig. Feed Industry, Shenyang, China. 20(5): 26-27.
PHỤ LỤC
MỘT SỐ HÌNH ẢNH THÍ NGHIỆM CỦA LUẬN ÁN

Máy NIR Thermo Scientific microPHAZER AG
| |
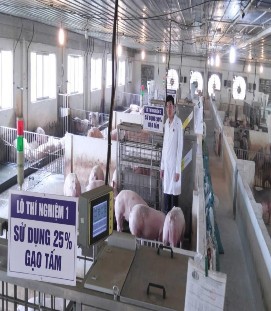
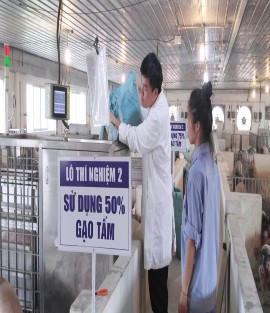
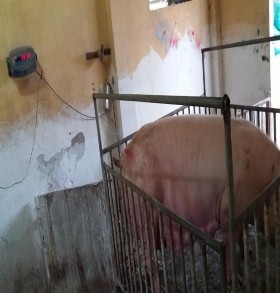
Phân lô ở thí nghiệm lợn thịt | Cho lợn thịt ăn thức ăn thí nghiệm |
|
|
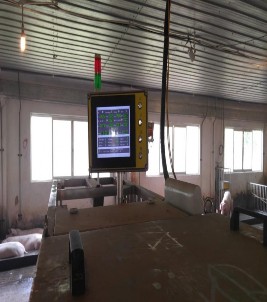
Máy tính LTATN tự động của lợn thịt | Lợn thí nghiệm được theo dòi qua thẻ tai |
Có thể bạn quan tâm!
-
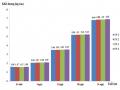
 Thời Gian Động Dục Trở Lại Sau Cai Sữa Của Lợn Nái
 -
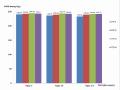
 Khối Lượng Lợn Con Thí Nghiệm Giai Đoạn Sơ Sinh Đến 24 Ngày Tuổi
 -
 Sử dụng gạo lật và gạo tấm thay thế ngô làm thức ăn cho lợn - 15
 -
 Sử dụng gạo lật và gạo tấm thay thế ngô làm thức ăn cho lợn - 17
 -
 Sử dụng gạo lật và gạo tấm thay thế ngô làm thức ăn cho lợn - 18
Xem toàn bộ 144 trang tài liệu này.
| |
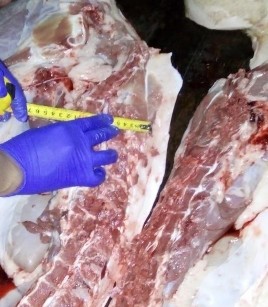
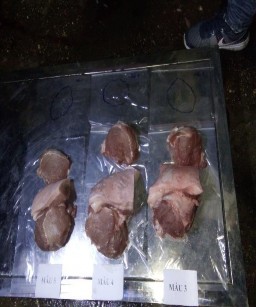
Đo chỉ số thân thịt của lợn thịt thí nghiệm | Lấy mẫu thịt để phân tích chất lượng |
|
|
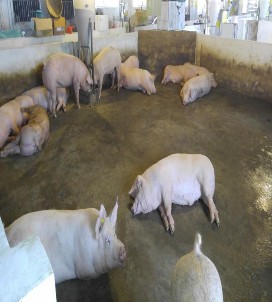
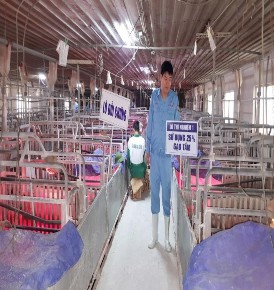
Phân lô ở thí nghiệm lợn nái nuôi con | Cân lợn nái bằng cân điện tử |
MỘT SỐ KẾT QUẢ PHÂN TÍCH BẰNG PHẦN MỀM MINITAB 16
I. THÍ NGHIỆM LỢN NÁI NUÔI CON
1. Khối lượng lợn nái thí nghiệm
1.1. Lần thí nghiệm 1
Descriptive Statistics: Ngày 1
N N* | Mean SE | Mean StDev | CoefVar | Minimum | Q1 | Median | |
Ngày 1 ĐC | 10 0 | 242.31 | 3.77 11.92 | 4.92 | 225.50 | 231.35 | 242.65 |
TN | 1 10 0 | 235.60 | 8.16 25.82 | 10.96 | 193.00 | 218.63 | 235.00 |
TN | 2 10 0 | 244.6 | 11.4 35.9 | 14.70 | 187.7 | 225.4 | 239.9 |
TN | 3 10 0 | 239.15 | 4.38 13.87 | 5.80 | 221.70 | 227.18 | 237.55 |
One-way ANOVA: Ngày 1 versus Lô
Grouping Information Using Tukey Method
N | Mean Grouping | |
TN | 2 10 | 244.58 A |
ĐC | 10 | 242.31 A |
TN | 3 10 | 239.15 A |
TN | 1 10 | 235.60 A |
Descriptive Statistics: Ngày 14
N N* | Mean SE | Mean StDev | CoefVar | Minimum | Q1 | Median | |
Ngày 14 ĐC | 10 0 | 235.41 | 3.34 10.56 | 4.48 | 220.50 | 225.50 | 236.60 |
TN | 1 10 0 | 230.40 | 7.76 24.53 | 10.64 | 190.50 | 213.75 | 230.25 |
TN | 2 10 0 | 242.0 | 11.2 35.6 | 14.70 | 191.0 | 219.0 | 235.0 |
TN | 3 10 0 | 235.91 | 4.31 13.62 | 5.77 | 218.90 | 223.15 | 234.70 |
One-way ANOVA: Ngày 14 versus Lô
Grouping Information Using Tukey Method
N | Mean Grouping | |
TN | 2 10 | 241.96 A |
TN | 3 10 | 235.91 A |
ĐC | 10 | 235.41 A |
TN | 1 10 | 230.40 A |
Descriptive Statistics: Ngày 24
N N* | Mean SE | Mean StDev | CoefVar | Minimum | Q1 | Median | |
Ngày 24 ĐC | 10 0 | 233.44 | 3.23 10.21 | 4.37 | 217.90 | 225.00 | 234.15 |
TN | 1 10 0 | 232.68 | 7.70 24.35 | 10.46 | 187.90 | 219.63 | 230.50 |
TN | 2 10 0 | 236.3 | 10.6 33.6 | 14.21 | 194.6 | 209.5 | 230.6 |
TN | 3 10 0 | 237.33 | 4.50 14.24 | 6.00 | 220.50 | 222.63 | 235.60 |
One-way ANOVA: Ngày 24 versus Lô
Grouping Information Using Tukey Method
N | Mean Grouping | |
TN | 3 10 | 237.33 A |
TN | 2 10 | 236.31 A |
ĐC | 10 | 233.44 A |
TN | 1 10 | 232.68 A |
1.2. Lần thí nghiệm 2
Descriptive Statistics: Ngày 1
N N* | Mean SE | Mean StDev | CoefVar | Minimum | Q1 | Median | |
Ngày 1 ĐC | 10 0 | 244.81 | 9.51 30.07 | 12.28 | 203.60 | 223.38 | 242.65 |
TN | 1 10 0 | 249.15 | 6.99 22.11 | 8.87 | 220.70 | 231.25 | 245.15 |
TN | 2 10 0 | 239.5 | 10.2 32.2 | 13.45 | 196.5 | 216.6 | 238.7 |
TN | 3 10 0 | 239.80 | 7.31 23.12 | 9.64 | 214.90 | 223.50 | 238.40 |
One-way ANOVA: Ngày 1 versus Lô
Grouping Information Using Tukey Method
N | Mean | Grouping | |
TN | 1 10 | 249.15 | A |
ĐC | 10 | 244.81 | A |
TN | 3 10 | 239.80 | A |
TN | 2 10 | 239.51 | A |
Descriptive Statistics: Ngày 14
N N* Mean SE | Mean StDev | CoefVar | Minimum | Q1 | Median | |
Ngày 14 ĐC | 10 0 243.4 | 10.4 32.8 | 13.47 | 194.5 | 217.5 | 243.0 |
TN | 1 10 0 248.32 | 6.44 20.36 | 8.20 | 213.50 | 234.63 | 246.00 |
TN | 2 10 0 243.50 | 9.79 30.96 | 12.71 | 205.00 | 222.50 | 241.50 |
TN | 3 10 0 243.76 | 7.78 24.61 | 10.10 | 221.00 | 229.38 | 240.05 |
One-way ANOVA: Ngày 14 versus Lô
Grouping Information Using Tukey Method
Lô N Mean Grouping TN 1 10 248.32 A
TN 3 10 243.76 A
TN 2 10 243.50 A
ĐC 10 243.40 A
Descriptive Statistics: Ngày 24
N N* Mean SE Mean StDev | CoefVar | Minimum | Q1 | Median | |
Ngày 24 ĐC | 10 0 238.8 10.4 33.0 | 13.84 | 190.0 | 213.0 | 239.5 |
TN | 1 10 0 248.74 7.24 22.88 | 9.20 | 210.00 | 233.38 | 245.75 |
TN | 2 10 0 246.88 8.19 25.90 | 10.49 | 213.00 | 228.13 | 243.75 |
TN | 3 10 0 244.92 8.06 25.47 | 10.40 | 214.50 | 224.30 | 244.00 |
One-way ANOVA: Ngày 24 versus Lô
Grouping Information Using Tukey Method
N | Mean | Grouping | |
TN | 1 10 | 248.74 | A |
TN | 2 10 | 246.88 | A |
TN | 3 10 | 244.92 | A |
ĐC | 10 | 238.81 | A |
1.3. Lần thí nghiệm 3
Descriptive Statistics: Ngày 1
N N* | Mean SE | Mean StDev | CoefVar | Minimum | Q1 Median | |
Ngày 1 ĐC | 10 0 | 234.79 | 5.75 18.19 | 7.75 | 215.70 | 219.85 229.15 |
TN | 1 10 0 | 242.88 | 6.33 20.02 | 8.24 | 218.70 | 225.10 239.95 |
TN | 2 10 0 | 249.0 | 11.8 37.3 | 14.97 | 201.0 | 230.8 244.4 |
TN | 3 10 0 | 250.65 | 5.80 18.33 | 7.31 | 222.00 | 234.28 250.50 |
One-way ANOVA: Ngày 1 versus Lô
Grouping Information Using Tukey Method
Lô N Mean Grouping TN 3 10 250.65 A
TN 2 10 248.97 A
TN 1 10 242.88 A
ĐC 10 234.79 A
Descriptive Statistics: Ngày 14
N N* | Mean SE | Mean StDev | CoefVar | Minimum | Q1 Median | |
Ngày 14 ĐC | 10 0 | 230.69 | 6.22 19.66 | 8.52 | 209.70 | 214.60 224.85 |
TN | 1 10 0 | 239.90 | 6.72 21.24 | 8.85 | 213.40 | 222.97 235.50 |
TN | 2 10 0 | 245.8 | 11.5 36.4 | 14.82 | 198.0 | 229.9 239.5 |
TN | 3 10 0 | 247.03 | 5.58 17.65 | 7.14 | 220.10 | 234.77 248.30 |
One-way ANOVA: Ngày 14 versus Lô
Grouping Information Using Tukey Method
Lô N Mean Grouping TN 3 10 247.03 A
TN 2 10 245.75 A
TN 1 10 239.90 A
ĐC 10 230.69 A
Descriptive Statistics: Ngày 24
N N* | Mean SE | Mean StDev | CoefVar | Minimum | Q1 | Median | |
Ngày 24 ĐC | 10 0 | 226.92 | 6.12 19.35 | 8.53 | 201.80 | 214.75 | 220.60 |
TN | 1 10 0 | 237.47 | 7.03 22.22 | 9.36 | 209.80 | 223.03 | 229.50 |
TN | 2 10 0 | 241.7 | 11.9 37.7 | 15.59 | 190.0 | 225.6 | 236.1 |
TN | 3 10 0 | 244.26 | 5.12 16.18 | 6.63 | 223.00 | 231.35 | 241.80 |
One-way ANOVA: Ngày 24 versus Lô
Grouping Information Using Tukey Method
Lô N Mean Grouping TN 3 10 244.26 A
TN 2 10 241.69 A
TN 1 10 237.47 A
ĐC 10 226.92 A
1.4. Cả 3 lần thí nghiệm
Descriptive Statistics: Ngày 1
N N* Mean SE | Mean StDev | CoefVar | Minimum | Q1 | Median | |
Ngày 1 ĐC | 30 0 240.64 | 3.86 21.12 | 8.78 | 203.60 | 226.68 | 238.65 |
TN | 1 30 0 242.54 | 4.14 22.69 | 9.35 | 193.00 | 222.43 | 239.00 |
TN | 2 30 0 244.35 | 6.24 34.20 | 14.00 | 187.70 | 226.90 | 240.50 |
TN | 3 30 0 243.20 | 3.46 18.94 | 7.79 | 214.90 | 229.77 | 239.80 |
One-way ANOVA: Ngày 1 versus Lô
Grouping Information Using Tukey Method Lô N Mean Grouping
TN 2 30 244.35 A
TN 3 30 243.20 A
TN 1 30 242.54 A
ĐC 30 240.64 A