CSVC1 | 11.28 | 6.453 | .550 | .711 |
CSVC2 | 11.37 | 6.133 | .573 | .699 |
CSVC3 | 11.03 | 7.422 | .636 | .687 |
CSVC4 | 11.29 | 6.635 | .524 | .725 |
Có thể bạn quan tâm!
-
 Bảng Kết “Quả Phân Tích Efa” Biến Phụ Thuộc
 -
 Nâng Cao Độ Tin Cậy Và Tính Công Khai Minh Bạch C A Công Tác
 -
 Phân tích các nhân tố ảnh hưởng đến mức độ hài lòng của người nộp thuế đối với chất lượng dịch vụ hành chính thuế tại Chi Cục Thuế thành phố Cà Mau tỉnh Cà Mau - 7
Xem toàn bộ 72 trang tài liệu này.
3.3. Biến S Cảm thông
Reliability Statistics
Cronbach's Alpha
N of Items
.833
3
Item Statistics | |||
| Mean | Std. Deviation | N |
SCT1 | 3.83 | 1.007 | 280 |
SCT2 | 3.85 | 1.025 | 280 |
SCT3 | 3.77 | 1.051 | 280 |
Item-Total Statistics | ||||
| Scale Mean if Item Deleted | Scale Variance if Item Deleted | Corrected Item-Total Correlation | Cronbach's Alpha if Item Deleted |
SCT1 | 7.62 | 3.534 | .682 | .781 |
SCT2 | 7.60 | 3.438 | .695 | .768 |
SCT3 | 7.69 | 3.327 | .704 | .759 |
3.4. Biến Dân ch
Reliability Statistics | |
Cronbach's Alpha | N of Items |
.786 | 4 |
Item Statistics | |||
| Mean | Std. Deviation | N |
TDCVCB1 | 3.77 | 1.023 | 280 |
TDCVSCB2 | 3.84 | 1.065 | 280 |
TDCVSCB3 | 3.74 | 1.108 | 280 |
TDCVSCB4 | 3.80 | 1.088 | 280 |
Item-Total Statistics | ||||
| Scale Mean if Item Deleted | Scale Variance if Item Deleted | Corrected Item-Total Correlation | Cronbach's Alpha if Item Deleted |
TDCVSCB1 | 11.38 | 6.909 | .600 | .730 |
TDCVSCB2 | 11.31 | 7.067 | .527 | .766 |
TDCVSCB3 | 11.41 | 6.300 | .658 | .699 |
TDCVSCB4 | 11.34 | 6.684 | .590 | .735 |
3.5. Biến Năng l c phục vụ
Reliability Statistics | |
Cronbach's Alpha | N of Items |
.793 | 5 |
Item Statistics | |||
| Mean | Std. Deviation | N |
NLPV1 | 3.74 | 1.098 | 280 |
NLPV2 | 3.74 | 1.119 | 280 |
NLPV3 | 3.72 | 1.105 | 280 |
NLPV4 | 3.71 | 1.173 | 280 |
NLPV5 | 3.77 | 1.037 | 280 |
Item-Total Statistics | ||||
| Scale Mean if Item Deleted | Scale Variance if Item Deleted | Corrected Item-Total Correlation | Cronbach's Alpha if Item Deleted |
NLPV1 | 14.94 | 10.989 | .629 | .736 |
NLPV2 | 14.93 | 11.182 | .580 | .752 |
NLPV3 | 14.96 | 11.568 | .530 | .768 |
NLPV4 | 14.96 | 11.117 | .547 | .763 |
NLPV5 | 14.91 | 11.590 | .582 | .752 |
3.6. Biến minh bạch
Reliability Statistics | |
Cronbach's Alpha | N of Items |
.823 | 4 |
Item Statistics | |||
| Mean | Std. Deviation | N |
SCKMB1 | 3.78 | 1.050 | 280 |
SCKMB2 | 3.86 | 1.031 | 280 |
SCKMB3 | 3.81 | 1.130 | 280 |
SCKMB4 | 3.78 | 1.082 | 280 |
Item-Total Statistics | ||||
| Scale Mean if Item Deleted | Scale Variance if Item Deleted | Corrected Item-Total Correlation | Cronbach's Alpha if Item Deleted |
SCKMB1 | 11.45 | 7.259 | .653 | .774 |
SCKMB2 | 11.37 | 7.245 | .675 | .765 |
SCKMB3 | 11.42 | 6.911 | .651 | .775 |
SCKMB4 | 11.46 | 7.317 | .610 | .794 |
3.7. Biến đáp ứng
Reliability Statistics | |
Cronbach's Alpha | N of Items |
.769 | 5 |
Item Statistics | |||
| Mean | Std. Deviation | N |
MDDU1 | 3.90 | 1.054 | 280 |
MDDU2 | 3.79 | 1.003 | 280 |
MDDU3 | 3.86 | 1.021 | 280 |
MDDU4 | 3.82 | 1.042 | 280 |
MDDU5 | 3.59 | .990 | 280 |
Item-Total Statistics | ||||
| Scale Mean if Item Deleted | Scale Variance if Item Deleted | Corrected Item-Total Correlation | Cronbach's Alpha if Item Deleted |
MDDU1 | 15.07 | 8.508 | .643 | .688 |
MDDU2 | 15.17 | 9.184 | .557 | .721 |
MDDU3 | 15.10 | 8.606 | .656 | .685 |
MDDU4 | 15.14 | 8.940 | .569 | .716 |
MDDU5 | 15.37 | 10.715 | .290 | .805 |
Kết quả chạy lại lần 2 biến đáp ứng
Reliability Statistics | |
Cronbach's Alpha | N of Items |
.805 | 4 |
Item Statistics | |||
| Mean | Std. Deviation | N |
MDDU1 | 3.90 | 1.054 | 280 |
MDDU2 | 3.79 | 1.003 | 280 |
MDDU3 | 3.86 | 1.021 | 280 |
MDDU4 | 3.82 | 1.042 | 280 |
Item-Total Statistics | ||||
| Scale Mean if Item Deleted | Scale Variance if Item Deleted | Corrected Item-Total Correlation | Cronbach's Alpha if Item Deleted |
MDDU1 | 11.47 | 6.150 | .661 | .736 |
MDDU2 | 11.58 | 6.739 | .570 | .779 |
MDDU3 | 11.51 | 6.337 | .649 | .742 |
MDDU4 | 11.55 | 6.449 | .601 | .765 |
3.8. Biến s hài lòng
Reliability Statistics | |
Cronbach's Alpha | N of Items |
.862 | 4 |
Item Statistics | |||
| Mean | Std. Deviation | N |
SHL1 | 3.53 | .682 | 280 |
SHL2 | 3.58 | .704 | 280 |
SHL3 | 3.58 | .656 | 280 |
SHL4 | 3.56 | .695 | 280 |
Item-Total Statistics | ||||
| Scale Mean if Item Deleted | Scale Variance if Item Deleted | Corrected Item-Total Correlation | Cronbach's Alpha if Item Deleted |
SHL1 | 10.73 | 3.073 | .736 | .812 |
SHL2 | 10.68 | 3.015 | .732 | .814 |
SHL3 | 10.68 | 3.308 | .653 | .846 |
SHL4 | 10.70 | 3.072 | .715 | .821 |
4. Phân tích nhân tố khám phá EFA
4.1. Phân tích nhân tố khám phá EFA các biến độc lập
+ Kết quả EFA chạy lần 1
KMO and Bartlett's Test | ||
Kaiser-Meyer-Olkin Measure of Sampling Adequacy. | .815 | |
Bartlett's Test of Sphericity | Approx. Chi-Square | 3482.553 |
df | 406 | |
Sig. | .000 | |
Total Variance Explained
Component | Initial Eigenvalues | Extraction Sums of Squared Loadings | Rotation Sums of Squared Loadings | ||||||
Total | % of Variance | Cumulativ e % | Total | % of Variance | Cumulative % | Total | % of Variance | Cumulat ive % | |
1 | 6.408 | 22.098 | 22.098 | 6.408 | 22.098 | 22.098 | 3.242 | 11.178 | 11.178 |
2 | 2.591 | 8.933 | 31.031 | 2.591 | 8.933 | 31.031 | 2.884 | 9.944 | 21.123 |
3 | 2.372 | 8.180 | 39.211 | 2.372 | 8.180 | 39.211 | 2.810 | 9.689 | 30.812 |
4 | 2.316 | 7.985 | 47.195 | 2.316 | 7.985 | 47.195 | 2.653 | 9.148 | 39.960 |
5 | 1.949 | 6.722 | 53.917 | 1.949 | 6.722 | 53.917 | 2.591 | 8.934 | 48.895 |
6 | 1.754 | 6.048 | 59.966 | 1.754 | 6.048 | 59.966 | 2.476 | 8.538 | 57.433 |
7 | 1.510 | 5.209 | 65.174 | 1.510 | 5.209 | 65.174 | 2.245 | 7.741 | 65.174 |
8 | .806 | 2.778 | 67.953 |
|
|
|
|
|
|
9 | .726 | 2.504 | 70.456 |
|
|
|
|
|
|
10 | .691 | 2.384 | 72.841 |
|
|
|
|
|
|
11 | .662 | 2.284 | 75.124 |
|
|
|
|
|
|
12 | .632 | 2.180 | 77.304 |
|
|
|
|
|
|
13 | .587 | 2.025 | 79.330 |
|
|
|
|
|
|
14 | .539 | 1.859 | 81.189 |
|
|
|
|
|
|
15 | .529 | 1.823 | 83.012 |
|
|
|
|
|
|
16 | .499 | 1.720 | 84.732 |
|
|
|
|
|
|
17 | .484 | 1.668 | 86.400 |
|
|
|
|
|
|
18 | .479 | 1.651 | 88.051 |
|
|
|
|
|
|
19 | .448 | 1.546 | 89.596 |
|
|
|
|
|
|
20 | .402 | 1.387 | 90.984 |
|
|
|
|
|
|
21 | .378 | 1.304 | 92.288 |
|
|
|
|
|
|
22 | .374 | 1.289 | 93.577 |
|
|
|
|
|
|
23 | .368 | 1.268 | 94.844 |
|
|
|
|
|
|
24 | .341 | 1.176 | 96.020 |
|
|
|
|
|
|
25 | .307 | 1.059 | 97.079 |
|
|
|
|
|
|
26 | .299 | 1.031 | 98.111 |
|
|
|
|
|
|
27 | .273 | .943 | 99.053 |
|
|
|
|
|
|
28 | .143 | .495 | 99.548 |
|
|
|
|
|
|
29 | .131 | .452 | 100.000 |
|
|
|
|
|
|
| Component | ||||||
1 | 2 | 3 | 4 | 5 | 6 | 7 | |
NLPV1 | .775 |
|
|
|
|
|
|
NLPV2 | .740 |
|
|
|
|
|
|
NLPV5 | .698 |
|
|
|
|
|
|
NLPV4 | .677 |
|
|
|
|
|
|
NLPV3 | .670 |
|
|
|
|
|
|
CSVC3 | .653 |
|
|
|
|
| .591 |
STC2 |
| .795 |
|
|
|
|
|
STC3 |
| .792 |
|
|
|
|
|
STC1 |
| .786 |
|
|
|
|
|
STC5 |
| .742 |
|
|
|
|
|
SCT3 |
|
| .853 |
|
|
|
|
SCT2 |
|
| .845 |
|
|
|
|
SCT1 |
|
| .829 |
|
|
|
|
STC4 |
| .549 | .721 |
|
|
|
|
SCKMB2 |
|
|
| .822 |
|
|
|
SCKMB1 |
|
|
| .776 |
|
|
|
SCKMB3 |
|
|
| .773 |
|
|
|
SCKMB4 |
|
|
| .762 |
|
|
|
MDDU1 |
|
|
|
| .819 |
|
|
MDDU3 |
|
|
|
| .811 |
|
|
MDDU4 |
|
|
|
| .756 |
|
|
MDDU2 |
|
|
|
| .728 |
|
|
TDCVSCB3 |
|
|
|
|
| .814 |
|
TDCVSCB1 |
|
|
|
|
| .767 |
|
TDCVSCB2 |
|
|
|
|
| .718 |
|
TDCVSCB4 |
|
|
|
|
| .714 |
|
CSVC1 |
|
|
|
|
|
| .795 |
CSVC2 |
|
|
|
|
|
| .731 |
CSVC4 |
|
|
|
|
|
| .723 |
+ Kết quả chạy EFA lần 2
KMO and Bartlett's Test
Kaiser-Meyer-Olkin Measure of Sampling Adequacy. | .815 | |
Bartlett's Test of Sphericity | Approx. Chi-Square | 3067.248 |
df | 378 | |
Sig. | .000 | |
Total Variance Explained
Compon ent | Initial Eigenvalues | Extraction Sums of Squared Loadings | Rotation Sums of Squared Loadings | ||||||
Total | % of Variance | Cumulative % | Total | % of Variance | Cumulative % | Total | % of Variance | Cumulative % | |
1 | 5.937 | 21.203 | 21.203 | 5.937 | 21.203 | 21.203 | 2.881 | 10.289 | 10.289 |
2 | 2.519 | 8.996 | 30.199 | 2.519 | 8.996 | 30.199 | 2.818 | 10.065 | 20.354 |
3 | 2.347 | 8.381 | 38.580 | 2.347 | 8.381 | 38.580 | 2.806 | 10.021 | 30.375 |
4 | 2.281 | 8.147 | 46.727 | 2.281 | 8.147 | 46.727 | 2.644 | 9.443 | 39.818 |
5 | 1.938 | 6.923 | 53.650 | 1.938 | 6.923 | 53.650 | 2.582 | 9.222 | 49.040 |
6 | 1.613 | 5.761 | 59.410 | 1.613 | 5.761 | 59.410 | 2.470 | 8.823 | 57.862 |
7 | 1.478 | 5.279 | 64.689 | 1.478 | 5.279 | 64.689 | 1.912 | 6.827 | 64.689 |
8 | .795 | 2.839 | 67.528 |
|
|
|
|
|
|
9 | .725 | 2.590 | 70.117 |
|
|
|
|
|
|
10 | .680 | 2.430 | 72.547 |
|
|
|
|
|
|
11 | .659 | 2.352 | 74.899 |
|
|
|
|
|
|
12 | .632 | 2.256 | 77.155 |
|
|
|
|
|
|
13 | .578 | 2.063 | 79.219 |
|
|
|
|
|
|
14 | .539 | 1.924 | 81.143 |
|
|
|
|
|
|
15 | .528 | 1.886 | 83.028 |
|
|
|
|
|
|
16 | .498 | 1.779 | 84.807 |
|
|
|
|
|
|
17 | .480 | 1.713 | 86.521 |
|
|
|
|
|
|
18 | .478 | 1.708 | 88.228 |
|
|
|
|
|
|
19 |
.448 |
1.601 |
89.829 |
|
|
|
|
|
|
20 | .402 | 1.437 | 91.266 |
|
|
|
|
|
|
21 | .376 | 1.341 | 92.607 |
|
|
|
|
|
|
22 | .369 | 1.316 | 93.924 |
|
|
|
|
|
|
23 | .352 | 1.256 | 95.180 |
|
|
|
|
|
|
24 | .341 | 1.218 | 96.398 |
|
|
|
|
|
|
25 | .306 | 1.094 | 97.492 |
|
|
|
|
|
|
26 | .299 | 1.068 | 98.560 |
|
|
|
|
|
|
27 | .272 | .972 | 99.532 |
|
|
|
|
|
|
28 | .131 | .468 | 100.000 |
|
|
|
|
|
|
| |||||||||
| Component |
| |||||||
1 | 2 | 3 | 4 | 5 | 6 | 7 | |||
STC2 | .796 |
|
|
|
|
|
| ||
STC3 | .792 |
|
|
|
|
|
| ||
STC1 | .788 |
|
|
|
|
|
| ||
STC5 | .742 |
|
|
|
|
|
| ||
NLPV1 |
| .766 |
|
|
|
|
| ||
NLPV2 |
| .739 |
|
|
|
|
| ||
NLPV5 |
| .722 |
|
|
|
|
| ||
NLPV4 |
| .689 |
|
|
|
|
| ||
NLPV3 |
| .655 |
|
|
|
|
| ||
SCT3 |
|
| .853 |
|
|
|
| ||
SCT2 |
|
| .845 |
|
|
|
|
SCT1 |
|
| .829 |
|
|
|
|
STC4 | .550 |
| .722 |
|
|
|
|
SCKMB2 |
|
|
| .825 |
|
|
|
SCKMB1 |
|
|
| .773 |
|
|
|
SCKMB3 |
|
|
| .773 |
|
|
|
SCKMB4 |
|
|
| .764 |
|
|
|
MDDU1 |
|
|
|
| .819 |
|
|
MDDU3 |
|
|
|
| .811 |
|
|
MDDU4 |
|
|
|
| .758 |
|
|
MDDU2 |
|
|
|
| .730 |
|
|
TDCVSCB3 |
|
|
|
|
| .817 |
|
TDCVSCB1 |
|
|
|
|
| .769 |
|
TDCVSCB4 |
|
|
|
|
| .715 |
|
TDCVSCB2 |
|
|
|
|
| .714 |
|
CSVC1 |
|
|
|
|
|
| .801 |
CSVC4 |
|
|
|
|
|
| .732 |
CSVC2 |
|
|
|
|
|
| .727 |
+ Kết quả chạy EFA lần 3
KMO and Bartlett's Test
Kaiser-Meyer-Olkin Measure of Sampling Adequacy. | .814 | |
Bartlett's Test of Sphericity | Approx. Chi-Square | 2620.708 |
df | 351 | |
Sig. | .000 | |
Total Variance Explained
Component | Initial Eigenvalues | Extraction Sums of Squared Loadings | Rotation Sums of Squared Loadings | ||||||
Total | % of Variance | Cumulative % | Total | % of Variance | Cumulative % | Total | % of Variance | Cumulative % | |
1 | 5.524 | 20.458 | 20.458 | 5.524 | 20.458 | 20.458 | 2.802 | 10.377 | 10.377 |
2 | 2.368 | 8.769 | 29.227 | 2.368 | 8.769 | 29.227 | 2.636 | 9.762 | 20.139 |
3 | 2.324 | 8.606 | 37.833 | 2.324 | 8.606 | 37.833 | 2.601 | 9.634 | 29.774 |
4 | 2.086 | 7.727 | 45.560 | 2.086 | 7.727 | 45.560 | 2.581 | 9.559 | 39.333 |
5 | 1.906 | 7.061 | 52.621 | 1.906 | 7.061 | 52.621 | 2.470 | 9.148 | 48.481 |
6 | 1.608 | 5.954 | 58.575 | 1.608 | 5.954 | 58.575 | 2.284 | 8.458 | 56.938 |
7 | 1.470 | 5.445 | 64.020 | 1.470 | 5.445 | 64.020 | 1.912 | 7.081 | 64.020 |
8 | .795 | 2.944 | 66.963 |
|
|
|
|
|
|
9 | .725 | 2.685 | 69.649 |
|
|
|
|
|
|
10 | .680 | 2.520 | 72.169 |
|
|
|
|
|
|
11 | .658 | 2.438 | 74.606 |
|
|
|
|
|
|
12 | .629 | 2.329 | 76.936 |
|
|
|
|
|
|
13 | .578 | 2.139 | 79.075 |
|
|
|
|
|
|
14 | .535 | 1.980 | 81.055 |
|
|
|
|
|
|
15 | .527 | 1.953 | 83.007 |
|
|
|
|
|
|
16 | .498 | 1.843 | 84.851 |
|
|
|
|
|
|
17 | .478 | 1.771 | 86.622 |
|
|
|
|
|
|
18 | .471 | 1.746 | 88.368 |
|
|
|
|
|
|
19 | .447 | 1.654 | 90.022 |
|
|
|
|
|
|
20 | .396 | 1.467 | 91.490 |
|
|
|
|
|
|
21 | .375 | 1.390 | 92.879 |
|
|
|
|
|
|
22 | .359 | 1.330 | 94.209 |
|
|
|
|
|
|
23 | .351 | 1.299 | 95.509 |
|
|
|
|
|
|
24 | .339 | 1.254 | 96.763 |
|
|
|
|
|
|
25 | .305 | 1.129 | 97.893 |
|
|
|
|
|
|
26 | .297 | 1.101 | 98.994 |
|
|
|
|
|
|
27 | .272 | 1.006 | 100.000 |
|
|
|
|
|
|
| Component | ||||||
1 | 2 | 3 | 4 | 5 | 6 | 7 | |
NLPV1 | .766 |
|
|
|
|
|
|
NLPV2 | .739 |
|
|
|
|
|
|
NLPV5 | .723 |
|
|
|
|
|
|
NLPV4 | .691 |
|
|
|
|
|
|
NLPV3 | .655 |
|
|
|
|
|
|
SCKMB2 |
| .825 |
|
|
|
|
|
SCKMB3 |
| .774 |
|
|
|
|
|
SCKMB1 |
| .774 |
|
|
|
|
|
SCKMB4 |
| .764 |
|
|
|
|
|
STC2 |
|
| .796 |
|
|
|
|
STC1 |
|
| .793 |
|
|
|
|
STC3 |
|
| .785 |
|
|
|
|
STC5 |
|
| .753 |
|
|
|
|
MDDU1 |
|
|
| .818 |
|
|
|
MDDU3 |
|
|
| .811 |
|
|
|
MDDU4 |
|
|
| .759 |
|
|
|
MDDU2 |
|
|
| .732 |
|
|
|
TDCVSCB3 |
|
|
|
| .817 |
|
|
TDCVSCB1 |
|
|
|
| .770 |
|
|
TDCVSCB4 |
|
|
|
| .716 |
|
|
TDCVSCB2 |
|
|
|
| .713 |
|
|
SCT3 |
|
|
|
|
| .860 |
|
SCT2 |
|
|
|
|
| .843 |
|
SCT1 |
|
|
|
|
| .830 |
|
CSVC1 |
|
|
|
|
|
| .799 |
CSVC4 |
|
|
|
|
|
| .733 |
CSVC2 |
|
|
|
|
|
| .728 |
4.2. Biến Phụ Thuộc
KMO and Bartlett's Test
Kaiser-Meyer-Olkin Measure of Sampling Adequacy. | .807 | |
Bartlett's Test of Sphericity | Approx. Chi-Square | 511.130 |
df | 6 | |
Sig. | .000 | |
Total Variance Explained
Component | Initial Eigenvalues | Extraction Sums of Squared Loadings | ||||
Total | % of Variance | Cumulative % | Total | % of Variance | Cumulative % | |
1 | 2.828 | 70.693 | 70.693 | 2.828 | 70.693 | 70.693 |
2 | .497 | 12.428 | 83.121 |
|
|
|
3 | .379 | 9.469 | 92.590 |
|
|
|
4 | .296 | 7.410 | 100.000 |
|
|
|
Component Matrixa
| Component |
1 | |
SHL1 | .860 |
SHL2 | .857 |
SHL4 | .845 |
SHL3 | .801 |
Correlations | |||||||||
| F_SHL | F_NLP V | F_SCK MB | F_CSV C | F_STC | F_SCT | F_TDC VSCB | F_MD DU | |
F_SHL | Pearson Correlation | 1 | .482** | .488** | .389** | .458** | .552** | .396** | .451** |
Sig. (2-tailed) |
| .000 | .000 | .000 | .000 | .000 | .000 | .000 | |
N | 280 | 280 | 280 | 280 | 280 | 280 | 280 | 280 | |
F_NLPV | Pearson Correlation | .482** | 1 | .233** | .211** | .294** | .173** | .335** | .185** |
Sig. (2-tailed) | .000 |
| .000 | .000 | .000 | .004 | .000 | .002 | |
N | 280 | 280 | 280 | 280 | 280 | 280 | 280 | 280 | |
F_SCK MB | Pearson Correlation | .488** | .233** | 1 | .282** | .157** | .218** | .272** | .144* |
Sig. (2-tailed) | .000 | .000 |
| .000 | .008 | .000 | .000 | .016 | |
N | 280 | 280 | 280 | 280 | 280 | 280 | 280 | 280 | |
F_CSVC | Pearson Correlation | .389** | .211** | .282** | 1 | .161** | .199** | .189** | .242** |
Sig. (2-tailed) | .000 | .000 | .000 |
| .007 | .001 | .002 | .000 | |
N | 280 | 280 | 280 | 280 | 280 | 280 | 280 | 280 | |
F_STC | Pearson Correlation | .458** | .294** | .157** | .161** | 1 | .192** | .158** | .143* |
Sig. (2-tailed) | .000 | .000 | .008 | .007 |
| .001 | .008 | .016 | |
N | 280 | 280 | 280 | 280 | 280 | 280 | 280 | 280 | |
F_SCT | Pearson Correlation | .552** | .173** | .218** | .199** | .192** | 1 | .219** | .164** |
Sig. (2-tailed) | .000 | .004 | .000 | .001 | .001 |
| .000 | .006 | |
N | 280 | 280 | 280 | 280 | 280 | 280 | 280 | 280 | |
F_TDCV SCB | Pearson Correlation | .396** | .335** | .272** | .189** | .158** | .219** | 1 | .157** |
Sig. (2-tailed) | .000 | .000 | .000 | .002 | .008 | .000 |
| .009 | |
N | 280 | 280 | 280 | 280 | 280 | 280 | 280 | 280 | |
F_MDD U | Pearson Correlation | .451** | .185** | .144* | .242** | .143* | .164** | .157** | 1 |
Sig. (2-tailed) | .000 | .002 | .016 | .000 | .016 | .006 | .009 |
| |
N | 280 | 280 | 280 | 280 | 280 | 280 | 280 | 280 | |
**. Correlation is significant at the 0.01 level (2-tailed). |
*. Correlation is significant at the 0.05 level (2-tailed). |
Model Summaryb
Mod el | R | R Square | Adjusted R Square | Std. Error of the Estimate | Durbin- Watson |
1 | .834a | .696 | .688 | .32155 | 1.776 |
| ||||||
Model | Sum of Squares | df | Mean Square | F | Sig. | |
1 | Regression | 64.250 | 7 | 9.179 | 88.774 | .000b |
Residual | 28.123 | 272 | .103 |
|
| |
Total | 92.373 | 279 |
|
|
| |
Coefficientsa | ||||||||
Model | Unstandardized Coefficients | Standardized Coefficients | t | Sig. | Collinearity Statistics | |||
B | Std. Error | Beta | Tolerance | VIF | ||||
1 | (Constant) | -.116 | .152 |
| -.761 | .447 |
|
|
F_NLPV | .141 | .026 | .201 | 5.376 | .000 | .798 | 1.253 | |
F_SCKMB | .160 | .024 | .242 | 6.634 | .000 | .841 | 1.188 | |
F_CSVC | .060 | .023 | .095 | 2.626 | .009 | .850 | 1.177 | |
F_STC | .150 | .023 | .229 | 6.416 | .000 | .881 | 1.135 | |
F_SCT | .219 | .023 | .340 | 9.551 | .000 | .886 | 1.129 | |
F_TDCVSCB | .065 | .025 | .094 | 2.560 | .011 | .825 | 1.212 | |
F_MDDU | .177 | .025 | .252 | 7.177 | .000 | .905 | 1.105 | |
Residuals Statisticsa
| Minimum | Maximum | Mean | Std. Deviation | N |
Predicted Value | 1.5854 | 4.3738 | 3.5652 | .47988 | 280 |
Residual | -1.76610 | 1.25516 | .00000 | .31749 | 280 |
Std. Predicted Value | -4.126 | 1.685 | .000 | 1.000 | 280 |
Std. Residual | -5.492 | 3.903 | .000 | .987 | 280 |
Dependent Variable: F_SHL
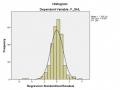
BIỂU ĐỒ HISTOGRAM

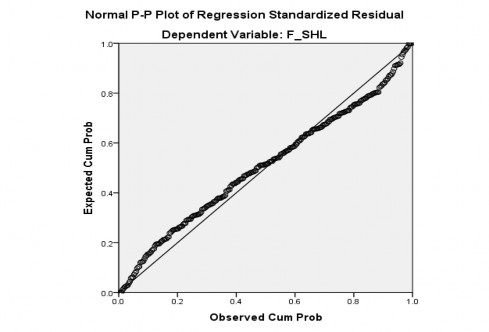
BIỂU ĐỒ NORMAL P-P PLOT
BIỂU ĐỒ SCATTER

6. Phân tích s khác biệt
+ Giới Tính
Group Statistics | |||||
| GIOITINH | N | Mean | Std. Deviation | Std. Error Mean |
F_SHL | NAM | 158 | 3.5649 | .62979 | .05010 |
NU | 122 | 3.5656 | .49876 | .04516 | |
Independent Samples Test | ||||||||||
| Levene's Test for Equality of Variances | t-test for Equality of Means | ||||||||
F | Sig. | t | df | Sig. (2- tailed) | Mean Difference | Std. Error Difference | 95% Confidence Interval of the Difference | |||
Lower | Upper | |||||||||
F_SHL | Equal variances assumed | 5.589 | .019 | -.010 | 278 | .992 | -.00070 | .06947 | -.13746 | .13606 |
Equal variances not assumed |
|
|
-.010 |
277.811 |
.992 |
-.00070 |
.06745 |
-.13348 |
.13208 | |
+ Độ tuổi
Test of Homogeneity of Variances | |||
F_SHL | |||
Levene Statistic | df1 | df2 | Sig. |
1.670 | 3 | 276 | .174 |
ANOVA | |||||
F_SHL | |||||
| Sum of Squares | df | Mean Square | F | Sig. |
Between Groups | .669 | 3 | .223 | .671 | .570 |
Within Groups | 91.704 | 276 | .332 |
|
|
Total | 92.373 | 279 |
|
|
|
+ Trình độ h c vấn
Test of Homogeneity of Variances
F_SHL | |||
Levene Statistic | df1 | df2 | Sig. |
2.012 | 3 | 276 | .112 |
ANOVA
F_SHL | |||||
| Sum of Squares | df | Mean Square | F | Sig. |
Between Groups | 1.603 | 3 | .534 | 1.625 | .184 |
Within Groups | 90.770 | 276 | .329 |
|
|
Total | 92.373 | 279 |
|
|
|
+ Nghề nghiệp
Test of Homogeneity of Variances
F_SHL | |||
Levene Statistic | df1 | df2 | Sig. |
.214 | 2 | 277 | .807 |
ANOVA
F_SHL | |||||
| Sum of Squares | df | Mean Square | F | Sig. |
Between Groups | .353 | 2 | .177 | .532 | .588 |
Within Groups | 92.020 | 277 | .332 |
|
|
Total | 92.373 | 279 |
|
|
|