3 | 0 | 139,5 | 0,1708 | - | - | ||
4 | 1 | 0,05 | 164,4 | 0,2168 | 95,72 | ||
5 | 2 | 2 | 0,05 | 170,0 | 0,2271 | 106,81 | 95,59 ± 11,27 |
6 | 3 | 0,05 | 162,3 | 0,2129 | 84,26 | ||
7 | 1 | 0,15 | 224,1 | 0,3271 | 105,45 | ||
8 | 3 | 2 | 0,15 | 209,6 | 0,3003 | 84,39 | 93,17 ± 10,96 |
9 | 3 | 0,15 | 212,3 | 0,3053 | 89,68 | ||
10 | 1 | 0,2 | 229,8 | 0,3376 | 84,35 | ||
11 | 4 | 2 | 0,2 | 243,2 | 0,3623 | 94,33 | 90,45 ± 5,35 |
12 | 3 | 0,2 | 239,8 | 0,3561 | 92,67 |
Có thể bạn quan tâm!
-
 Hàm Lượng Protein Toàn Phần Trong Máu Chuột Ở Các Lô Thí Nghiệm
 -
 Đánh Giá Ảnh Hưởng Của Sản Phẩm Cao Lên Độ Bền Chắc Của Xương Chuột
 -
 Hình Ảnh Một Số Dụng Cụ, Thiết Bị Dùng Trong Đề Tài
 -
 Phân Tích Độ Thủy Phân Protein Dùng Phương Pháp Kết Tủa Với Tca
 -
 Kết Quả Tối Ưu Hóa Quá Trình Thủy Phân Bằng Enzyme Neutral Đáp Ứng Độ Thủy Phân
 -
 Nghiên cứu phát triển sản phẩm thực phẩm từ nguyên liệu cá sấu bằng kỹ thuật hóa sinh - 26
Xem toàn bộ 224 trang tài liệu này.
Kết quả xác định giới hạn phát hiện (LOD) và giới hạn định lượng (LOQ)
Mẫu | Lần lặp lại | Nồng độ (ppm) | S/N* | |
1 | 1 | 1 | 0,06 | 22,1 |
2 | 2 | 0,06 | 21,5 | |
3 | 3 | 0,06 | 22,4 | |
4 | 2 | 1 | 0,03 | 10,2 |
5 | 2 | 0,03 | 10,0 | |
6 | 3 | 0,03 | 10,3 | |
7 | 3 | 1 | 0,01 | 3,8 |
8 | 2 | 0,01 | 4,1 | |
9 | 3 | 0,01 | 3,9 |
* S/N: Signal/ Noise (tín hiệu/ nhiễu đường nền) Như vậy giá trị LOD = 0,01 ppm và LOQ = 0,03 ppm.
Phụ lục 5. Kết quả xây dựng đường chuẩn hydroxylproline
Nồng độ (ppm) | Thời gian lưu (phút) | Diện tích (mAU*phút) | |
1 | 1 | 1,039 | 593,8 |
2 | 0,5 | 1,049 | 302,1 |
3 | 0,25 | 1,055 | 193,7 |
4 | 0,125 | 1,051 | 105,7 |
5 | 0,0625 | 1,057 | 91,0 |
6 | 0,03125 | 1,057 | 61,7 |
Phụ lục 6. Thống kê Stagraphic của thí nghiệm 1 đối với dẫn xuất A, theo kiểu LSD
Multiple Range Tests for Dien tich by Nghiem thuc Method: 95.0 percent LSD
Count | Mean | Homogeneous Groups |
3 | 566.1 | x | |
40 | 3 | 662.9 | x |
30 | 3 | 664.067 | x |
20 | 3 | 665.3 | x |
Sig. | Difference | +/- Limits | |
10 - 20 | * | -99.2 | 89.2977 |
10 - 30 | * | -97.9667 | 89.2977 |
10 - 40 | * | -96.8 | 89.2977 |
20 - 30 | 1.2333 | 89.2977 | |
20 - 40 | 2.4 | 89.2977 | |
30 - 40 | 1.16667 | 89.2977 |
* denotes a statistically significant difference.
The StatAdvisor
This table applies a multiple comparison procedure to determine which means are significantly different from which others. The bottom half of the output shows the estimated difference between each pair of means. An asterisk has been placed next to 3 pairs, indicating that these pairs show statistically significant differences at the 95.0% confidence level. At the top of the page, 2 homogenous groups are identified using columns of X’s. Within each column, the levels containing X’s form a group of means within which there are no statistically significant differences. The method currently being used to discriminate among the means is Fisher’s least significant difference (LSD) procedure. With this method, there is a 5.0% risk of calling each pair of means significantly different when the actual difference equals 0.
Phụ lục 7. Thống kê Stagraphic của thí nghiệm 1 đối với dẫn xuất B, theo kiểu LSD
ANOVA table for Dien tich bty The tich A
Sum of Squares | Df | Mean Square | F-Ratio | P-Value | |
Between groups | 2.16127E6 | 3 | 720425. | 3.20 | 0.0835 |
Within groups | 1.79945E6 | 8 | 224931. | ||
Total (Corr.) | 3.96072E6 | 11 |
The StatAdvisor
The ANOVA table decomposes the variance of Dien tich into two components: a between- group component and a within- group component. The F-ratio, which in this case equals 3.20287, is a ratio of the between-group estimate to the within-group estimate. Since the P-value of the F-test is greater than or equal to 0.05, there is not a statistically significant difference between the mean Dien tich from one level of The tich A to another at the 5% significance level.
Phụ lục 8. Bảng Anova cho thí nghiệm 1
Multiple Range Tests for Dien tich by The tich A Method: 95.0 percent Duncan
Count | Mean | Homogeneous Groups | ||
5 | 3 | 5661.0 | x | |
30 | 3 | 6629.0 | x | |
20 | 3 | 6640.67 | x | |
10 | 3 | 6653.0 | x | |
Constrat | Sig. | Difference | ||
5 - 10 | * | -992.0 | ||
5 - 20 | * | -979.667 | ||
5 - 30 | * | -968.0 | ||
10 - 20 | 12.333 | |||
10 - 30 | 24.0 | |||
20 - 30 | 11.6667 | |||
* denotes a statistically significant difference.
The StatAdvisor
This table applies a multiple comparison procedure to determine which means are significantly different from which others. The bottom half of the output shows the estimated difference between each pair of means. An asterisk has been placed next to 3 pairs, indicating that these pairs show statistically significant differences at the 95.0% confidence level. At the top of the page, 2 homogenous groups are identified using columns of X’s. Within each column, the levels containing X’s form a group of means within which there are no statistically significant differences. The method currently being used to discriminate among the means is Duncan’s multiple comparison procedure. With this method, there is a 5.0% risk of calling one or more pairs significantly different when their actual difference equals 0.
Phụ lục 9. Thống kê Stagraphic của thí nghiệm 1 đối với dẫn xuất A, theo kiểu Duncan
Multiple Range Tests for Dien tich by The tich A Method: 95.0 percent Duncan
Count | Mean | Homogeneous Groups | ||
10 | 3 | 5661.0 | x | |
40 | 3 | 6629.0 | x | |
30 | 3 | 6640.67 | x | |
20 | 3 | 6653.0 | x | |
Constrat | Sig. | Difference | ||
10 - 20 | * | -992.0 | ||
10 - 30 | * | -979.667 | ||
10 - 40 | * | -968.0 | ||
20 - 30 | 12.333 | |||
20 - 40 | 24.0 | |||
30 - 40 | 11.6667 | |||
* denotes a statistically significant difference.
The StatAdvisor
This table applies a multiple comparison procedure to determine which means are significantly different from which others. The bottom half of the output shows the estimated difference between each pair of means. An asterisk has been placed next to 3 pairs, indicating that these pairs show statistically significant differences at the 95.0% confidence level. At the top of the page, 2 homogenous groups are identified using columns of X’s. Within each column, the levels containing X’s form a group of means within which there are no statistically significant differences. The method currently being used to discriminate among the means is Duncan’s multiple comparison procedure. With this method, there is a 5.0% risk of calling one or more pairs significantly different when their actual difference equals 0
Phụ lục 10. Các hệ số của mẫu cao xương cá sấu sấy phun
Mẫu | Hệ số loãng F | pha | Khối mẫu (g) | lượng | Thể tích HCl 6N V1 (lít) | Thể tích mẫu hút V2 (µl) | được | Thể tích định mức V3 (µl) | |
1 | MP0 | 25 | 1,9261 | 0,01 | 2 | 2000 | |||
2 | M2P0 | 25 | 1,9508 | 0,01 | 2 | 2000 | |||
3 | M3P0 | 25 | 1,9128 | 0,01 | 2 | 2000 |
Phụ lục 11. Sắc ký đồ mẫu thêm chuẩn
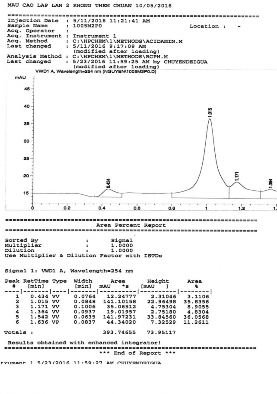
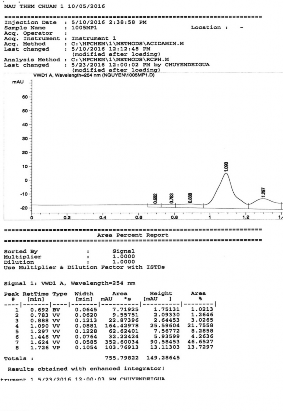
Mẫu không thêm chuẩn Mẫu thêm chuẩn 0,05 ppm
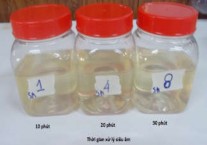
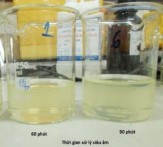
Phụ lục 12. Dịch trích có hỗ trợ siêu âm ở thời gian khác nhau
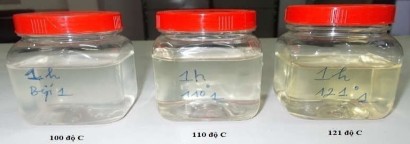
Phụ lục 13. Dịch trích nấu áp suất/ nhiệt độ cao sau 1 giờ
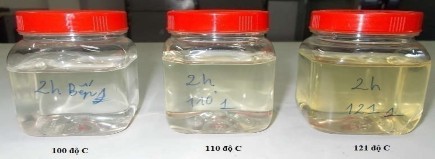
Phụ lục 14. Dịch trích nấu áp suất/ nhiệt độ cao sau 2 giờ
Phụ lục 15. Dịch trích ở 2 mức thời gian 2 giờ và 8 giờ, nấu cách thủy 100 °C
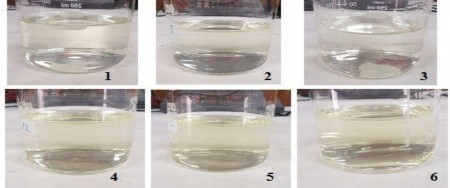
1. Nấu 2 giờ không xử lý; 2. Nấu 2 giờ có siêu âm 30 phút; 3. Nấu 2 giờ có vi sóng 10 phút, 630 W; 4. Nấu 8 giờ không xử lý; 5. Nấu 8 giờ có siêu âm 30 phút; 6. Nấu 8 giờ có vi sóng 10 phút, 630 W.
Phụ lục 16. Dịch trích ở 2 chế độ thời gian 1 giờ và 2 giờ nấu ở 121 °C,

1. Nấu 1 giờ không xử lý; 2. Nấu 1 giờ có siêu âm 30 phút;
3. Nấu 1 giờ có vi sóng 10 phút
Phụ lục 17. Số lần nấu, nấu 8 giờ/ 100 °C cách thủy, không xử lý vi sóng
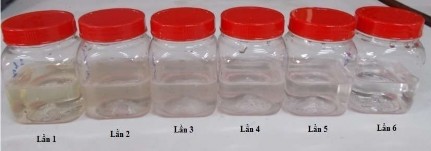
Phụ lục 18. Hình ảnh dịch theo số lần nấu, nấu 8h/ 100 °C cách thủy, có xử lý vi sóng 10 phút, 630 W
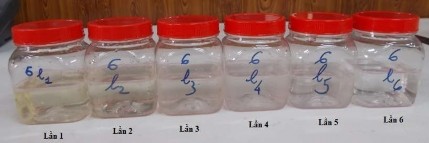
Phụ lục 19. Hình ảnh dịch theo số lần nấu, nấu 2 giờ/ 121 °C áp suất, không xử lý vi sóng
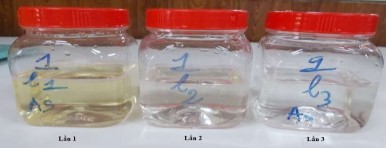
Phụ lục 20. Hình ảnh dịch theo số lần nấu, nấu 2 giờ/ 121 °C áp suất, có xử lý vi sóng 10 phút, 630 W
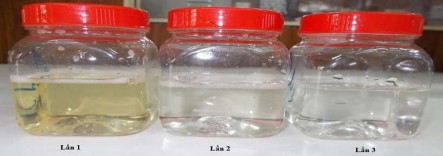
Phụ lục 21. Hình ảnh dịch theo số lần nấu, nấu 2 giờ/ 110 °C áp suất, không xử lý vi sóng

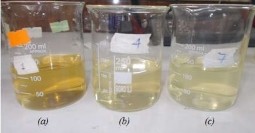
Phụ lục 22. Dịch trích ly collagen có xử lý vi sóng ở công suất - (a): 900W, (b): 630W, (c): 450W
Phụ lục 23. Kết quả phân tích hàm lượng protein (%), X1: Mẫu xương đã nấu 6 lần; X2: Mẫu xương đã nấu 6 lần sau khi khi trích 1 lần bằng acid acetic; X3: Mẫu xương ban đầu sau khi trích 1 lần bằng acid acetic
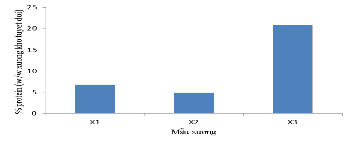
Phụ lục 24. Kết quả phân tích hàm lượng protein (%),

D1: Dịch trích bằng acid acetic của mẫu xương ban đầu; D2: Dịch trích bằng acid acetic của mẫu xương đã nấu 6 lần
Phụ lục 25. Sản phẩm sau khi cô đặc
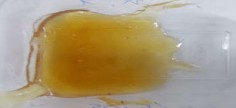
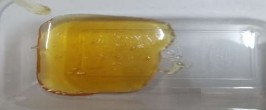
1. Cô đặc chân không - 0,4kg/cm2, 95°C 2. Cô đặc chân không - 0,8kg/cm2, 95°C
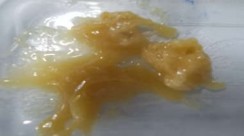
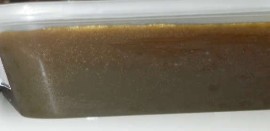
3. Cô đặc áp suất khí quyển, 100°C 4. Sản phẩm của công ty Cá Sấu Hoa Cà
Phụ lục 26. Sản phẩm bị cháy dưới đáy nồi khi cô đặc ở áp suất khí quyển

Phụ lục 27. Cách xây dựng đường chuẩn protein theo nồng độ, đo ở 595 nm
Xây dựng đường chuẩn: Dung dịch albumin chuẩn 0,1 mg/ ml: cân chính xác 0,0100 g albumin thêm nước cất và định mức tới 10 ml ta được dung dịch albumin chuẩn có nồng độ 1 mg/ ml. Hút 1 ml dung dịch albumin 1 mg /ml đã pha cho vào bình định mức 10 ml rồi thêm nước cất tới vạch định mức ta được dung dịch albumin có nồng độ 0,1 mg/ ml.


