QUAN
Frequency | Percent | Valid Percent | Cumulative Percent | ||
Valid | Q1 | 3 | 3.0 | 3.0 | 3.0 |
Q2 | 3 | 3.0 | 3.0 | 6.0 | |
Q3 | 3 | 3.0 | 3.0 | 9.0 | |
Q4 | 3 | 3.0 | 3.0 | 12.0 | |
Q5 | 3 | 3.0 | 3.0 | 15.0 | |
Q6 | 4 | 4.0 | 4.0 | 19.0 | |
Q7 | 4 | 4.0 | 4.0 | 23.0 | |
Q8 | 7 | 7.0 | 7.0 | 30.0 | |
Q9 | 4 | 4.0 | 4.0 | 34.0 | |
Q10 | 4 | 4.0 | 4.0 | 38.0 | |
Q11 | 4 | 4.0 | 4.0 | 42.0 | |
Q12 | 7 | 7.0 | 7.0 | 49.0 | |
Go_Vap | 9 | 9.0 | 9.0 | 58.0 | |
Tan_Binh | 7 | 7.0 | 7.0 | 65.0 | |
Tan_Phu | 7 | 7.0 | 7.0 | 72.0 | |
Binh_Thanh | 8 | 8.0 | 8.0 | 80.0 | |
Phu_Nhuan | 3 | 3.0 | 3.0 | 83.0 | |
Thu_Duc | 7 | 7.0 | 7.0 | 90.0 | |
Binh_Tan | 10 | 10.0 | 10.0 | 100.0 | |
Total | 100 | 100.0 | 100.0 |
Có thể bạn quan tâm!
-
 Kiến Nghị Đối Với Kdl Sinh Thái Mỹ Lệ:
 -
 Danh Sách Ký Hiệu Các Biến Trong Spss
 -
 Bảng Câu Hỏi Nghiên Cứu Định Lượng Bảng Câu Hỏi Nghiên Cứu Định Vị Thương Hiệu
 -
 Định vị thương hiệu khu du lịch Mỹ Lệ tại thị trường Thành phố Hồ Chí Minh - 14
Xem toàn bộ 117 trang tài liệu này.

NGNGHIEP
Frequency | Percent | Valid Percent | Cumulative Percent | ||
Valid | Học sinh-Sinh Viên | 16 | 16.0 | 16.0 | 16.0 |
Buôn bán nhỏ | 18 | 18.0 | 18.0 | 34.0 | |
Nhân viên khối nhà nước | 18 | 18.0 | 18.0 | 52.0 | |
Nhân viên công ty tư nhân- NN | 14 | 14.0 | 14.0 | 66.0 | |
Nghề nghiệp khác | 34 | 34.0 | 34.0 | 100.0 | |
Total | 100 | 100.0 | 100.0 |
HVAN
Frequency | Percent | Valid Percent | Cumulative Percent | ||
Valid | Pho thong co so | 2 | 2.0 | 2.0 | 2.0 |
Pho thong trung hoc | 46 | 46.0 | 46.0 | 48.0 | |
Caodang_Daihoc | 52 | 52.0 | 52.0 | 100.0 | |
Total | 100 | 100.0 | 100.0 |
![]()
TNHAP
Frequency | Percent | Valid Percent | Cumulative Percent | ||
Valid | < 5 trieu | 46 | 46.0 | 46.0 | 46.0 |
5-10 trieu | 42 | 42.0 | 42.0 | 88.0 | |
10-18 trieu | 12 | 12.0 | 12.0 | 100.0 | |
Total | 100 | 100.0 | 100.0 |
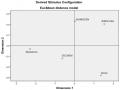
PHỤ LỤC 6: KẾT QUẢ VẼ BẢN ĐỒ NHẬN THỨC BẰNG MDS
(Nguồn: Kết quả phân tích từ SPSS)
Alscal
Case Processing Summarya
Valid | Missing | Total | |||
N | Percent | N | Percent | N | Percent |
5 | 100.0% | 0 | .0% | 5 | 100.0% |
a. Euclidean Distance used
Iteration history for the 2 dimensional solution (in squared distances) Young's S-stress formula 1 is used.
Iteration S-stress Improvement 1 .05585
2 .04454 .01131
3 .04410 .00043
Iterations stopped because
S-stress improvement is less than .001000 Stress and squared correlation (RSQ) in distances
RSQ values are the proportion of variance of the scaled data
(disparities)
in the partition (row, matrix, or entire data) which is accounted for by their corresponding distances.
Stress values are Kruskal's stress formula 1.
For matrix
Stress = .04583 RSQ = .99032
Configuration derived in 2 dimensions Stimulus Coordinates
Dimension
Stimulus Stimulus 1 2
Number Name
CQUAN | .4161 | -.0442 | |
2 | VTHU | .4292 | .6500 |
3 | CVNUOC | 2.3433 | -.0251 |
4 | LHOI | -2.0251 | -.7703 |
KPHA | -.7776 | -.7985 | |
6 | HBIET | 1.2326 | -.6280 |
7 | GIAODUC | -.7239 | .3996 |
8 | VANDONG | -1.3083 | .2051 |
9 | CGIACMAN | -1.1900 | 1.1421 |
10 | TCAM | -.1415 | -.2534 |
11 | CLUONG | 2.1172 | .1154 |
12 | GIA | -.3721 | .0073 |
![]()
![]()
![]()
![]()
![]()
Case Processing Summarya
Valid | Missing | Total | |||
N | Percent | N | Percent | N | Percent |
5 | 100.0% | 0 | .0% | 5 | 100.0% |
a. Euclidean Distance used
Iteration history for the 2 dimensional solution (in squared distances) Young's S-stress formula 1 is used.
Iteration S-stress Improvement 1 .01465
2 .01229 .00237
3 .01213 .00015
Iterations stopped because
S-stress improvement is less than .001000
Stress and squared correlation (RSQ) in distances
RSQ values are the proportion of variance of the scaled data
(disparities)
in the partition (row, matrix, or entire data) which
is accounted for by their corresponding distances.
Stress values are Kruskal's stress formula 1.
For matrix
Stress = .01248 RSQ = .99934
Configuration derived in 2 dimensions Stimulus Coordinates
Dimension
Stimulus 1 Name | 2 | |
1 | VAR1 1.3535 | -.2809 |
2 | VAR2 1.5354 | .2033 |
3 | VAR3 .0220 | .2291 |
4 | VAR4 -2.2877 | -.0311 |
5 | VAR5 -.6232 | -.1204 |
![]()
![]()