Reliability Statistics
N of Items | |
.836 | 4 |
Có thể bạn quan tâm!
-

 Các nhân tố ảnh hưởng đến sự hài lòng về chất lượng dịch vụ của khách hàng sử dụng thẻ Epartner của Ngân hàng TMCP Công thương Việt Nam trên địa bàn thành phố Hồ Chí Minh - 9
 -
 Kiến Nghị Đối Với Ngân Hàng Tmcp Công Thương Việt Nam:
 -
 Kết Quả Nghiên Cứu Định Tính
 -
 Các nhân tố ảnh hưởng đến sự hài lòng về chất lượng dịch vụ của khách hàng sử dụng thẻ Epartner của Ngân hàng TMCP Công thương Việt Nam trên địa bàn thành phố Hồ Chí Minh - 13
Xem toàn bộ 107 trang tài liệu này.
Item-Total Statistics
Scale Mean if Item Deleted | Scale Variance if Item Deleted | Corrected Item- Total Correlation | Cronbach's Alpha if Item Deleted | |
TC1 | 11.65339 | 2.243 | .625 | .824 |
TC2 | 11.15538 | 2.452 | .740 | .760 |
TC3 | 11.39044 | 2.551 | .693 | .782 |
TC4 | 11.61355 | 2.718 | .644 | .804 |
Thang đo phục vụ:
Reliability Statistics
N of Items | |
.874 | 5 |
Item-Total Statistics
Scale Mean if Item Deleted | Scale Variance if Item Deleted | Corrected Item- Total Correlation | Cronbach's Alpha if Item Deleted | |
PV1 | 12.7729 | 7.040 | .705 | .847 |
PV2 | 12.7769 | 7.478 | .603 | .870 |
PV3 | 12.7211 | 7.194 | .675 | .854 |
PV4 | 12.9243 | 6.142 | .782 | .828 |
PV5 | 12.9801 | 6.268 | .761 | .833 |
Thang đo hữu hình
Reliability Statistics
N of Items | |
.853 | 4 |
Item-Total Statistics
Scale Mean if Item Deleted | Scale Variance if Item Deleted | Corrected Item- Total Correlation | Cronbach's Alpha if Item Deleted | |
HH1 | 9.0837 | 1.477 | .668 | .827 |
HH2 | 9.2829 | 1.140 | .679 | .840 |
HH3 | 9.1554 | 1.348 | .735 | .797 |
HH4 | 9.1594 | 1.399 | .756 | .793 |
Thang đo đảm bảo
Reliability Statistics
N of Items | |
.759 | 5 |
Item-Total Statistics
Scale Mean if Item Deleted | Scale Variance if Item Deleted | Corrected Item- Total Correlation | Cronbach's Alpha if Item Deleted | |
DB1 | 13.4741 | 3.954 | .746 | .644 |
DB2 | 13.2112 | 4.119 | .653 | .675 |
DB3 | 13.4781 | 3.739 | .653 | .666 |
DB4 | 13.5299 | 4.570 | .383 | .765 |
DB5 | 12.8725 | 4.624 | .289 | .805 |
Bỏ biến DB5 ( câu 18)
Reliability Statistics
N of Items | |
.805 | 4 |
Item-Total Statistics
Scale Mean if Item Deleted | Scale Variance if Item Deleted | Corrected Item- Total Correlation | Cronbach's Alpha if Item Deleted | |
DB1 | 9.7052 | 2.841 | .664 | .738 |
DB2 | 9.4422 | 2.720 | .724 | .710 |
DB3 | 9.7092 | 2.615 | .597 | .772 |
DB4 | 9.7610 | 2.903 | .522 | .804 |
Thang đo cảm thông
Reliability Statistics
N of Items | |
.760 | 6 |
Item-Total Statistics
Scale Mean if Item Deleted | Scale Variance if Item Deleted | Corrected Item- Total Correlation | Cronbach's Alpha if Item Deleted | |
CT1 | 18.7649 | 4.365 | .635 | .685 |
CT2 | 18.7012 | 6.546 | .068 | .814 |
CT3 | 19.0199 | 4.900 | .556 | .710 |
CT4 | 18.7211 | 4.458 | .642 | .683 |
CT5 | 18.7171 | 4.996 | .635 | .693 |
CT6 | 18.7450 | 5.415 | .491 | .729 |
Loại biến CT2 (câu 20)
Reliability Statistics
N of Items | |
.814 | 5 |
Item-Total Statistics
Scale Mean if Item Deleted | Scale Variance if Item Deleted | Corrected Item- Total Correlation | Cronbach's Alpha if Item Deleted | |
CT1 | 14.9323 | 3.887 | .672 | .757 |
CT3 | 15.1873 | 4.473 | .564 | .789 |
CT4 | 14.8884 | 4.028 | .659 | .760 |
CT5 | 14.8845 | 4.567 | .644 | .769 |
CT6 | 14.9124 | 4.968 | .500 | .806 |
2.Kết quả phân tích nhân tố EFA:
Phân tích EFA đối với biến độc lập
Kaiser-Meyer-Olkin Measure of Sampling Adequacy. | .745 | |
Bartlett's Test of Sphericity | Approx. Chi-Square | 2.997E3 |
Df | 231 | |
Sig. | .000 | |
Rotated Component Matrixa
Component | |||||
1 | 2 | 3 | 4 | 5 | |
PV4 | .866 | ||||
PV5 | .854 | ||||
PV1 | .819 | ||||
PV3 | .788 | ||||
PV2 | .733 | ||||
CT1 | .834 | ||||
CT4 | .788 | ||||
CT5 | .746 | ||||
CT3 | .651 | ||||
CT6 | .608 | ||||
TC2 | .848 | ||||
TC1 | .825 | ||||
TC3 | .741 | ||||
TC4 | .722 |
.872 | .838 | ||||
HH3 | .843 | ||||
HH2 | .828 | ||||
HH1 | .811 | ||||
DB2 | |||||
DB3 | .754 | ||||
DB1 | .745 | ||||
DB4 | .695 |
HH4
Extraction Method: Principal Component Analysis. Rotation Method: Varimax with Kaiser Normalization.
a. Rotation converged in 6 iterations.
Total Variance Explained
Initial Eigenvalues | Extraction Sums of Squared Loadings | Rotation Sums of Squared Loadings | |||||||
Total | % of Variance | Cumulative % | Total | % of Variance | Cumulati ve % | Total | % of Variance | Cumula tive % | |
1 | 4.929 | 22.403 | 22.403 | 4.929 | 22.403 | 22.403 | 3.378 | 15.354 | 15.354 |
2 | 3.665 | 16.661 | 39.064 | 3.665 | 16.661 | 39.064 | 3.244 | 14.746 | 30.099 |
3 | 2.592 | 11.782 | 50.846 | 2.592 | 11.782 | 50.846 | 2.893 | 13.150 | 43.249 |
4 | 2.063 | 9.376 | 60.222 | 2.063 | 9.376 | 60.222 | 2.850 | 12.957 | 56.206 |
5 | 1.733 | 7.879 | 68.101 | 1.733 | 7.879 | 68.101 | 2.617 | 11.894 | 68.101 |
6 | .871 | 3.959 | 72.060 | ||||||
7 | .766 | 3.482 | 75.543 | ||||||
8 | .631 | 2.870 | 78.412 | ||||||
9 | .604 | 2.746 | 81.158 | ||||||
10 | .557 | 2.533 | 83.691 | ||||||
11 | .510 | 2.316 | 86.007 |
.467 | 2.121 | 88.129 | |||||||
13 | .408 | 1.853 | 89.981 | ||||||
14 | .363 | 1.651 | 91.632 | ||||||
15 | .348 | 1.583 | 93.215 | ||||||
16 | .296 | 1.346 | 94.561 | ||||||
17 | .268 | 1.219 | 95.780 | ||||||
18 | .255 | 1.159 | 96.939 | ||||||
19 | .218 | .993 | 97.932 | ||||||
20 | .192 | .872 | 98.804 | ||||||
21 | .154 | .700 | 99.504 | ||||||
22 | .109 | .496 | 100.000 | ||||||
Extraction Method: Principal Component Analysis. | |||||||||
12
3. Hồi quy tuyến tính:
Model Summaryb
R | R Square | Adjusted R Square | Std. Error of the Estimate | |
1 | .805a | .649 | .642 | .26469 |
a. Predictors: (Constant), CT, HH, PV, TC, DB
b. Dependent Variable: SHL
ANOVAb
Sum of Squares | df | Mean Square | F | Sig. | ||
1 | Regression | 31.712 | 5 | 6.342 | 90.52 8 | .000a |
Residual | 17.165 | 245 | .070 | |||
Total | 48.876 | 250 |
a. Predictors: (Constant), CT, HH, PV, TC, DB
b. Dependent Variable: SHL
Coefficientsa
Unstandardized Coefficients | Standardiz ed Coefficient s | t | Sig. | Collinearity Statistics | ||||
B | Std. Error | Beta | Toleranc e | VIF | ||||
1 | (Constant) | .183 | .218 | .840 | .402 | |||
TC | .317 | .037 | .368 | 8.633 | .000 | .791 | 1.265 | |
PV | .123 | .026 | .180 | 4.680 | .000 | .973 | 1.027 | |
HH | .123 | .045 | .105 | 2.738 | .007 | .970 | 1.031 | |
DB | .237 | .035 | .288 | 6.747 | .000 | .788 | 1.268 | |
CT | .316 | .037 | .366 | 8.605 | .000 | .793 | 1.260 | |
a. Dependent Variable: SHL | ||||||||
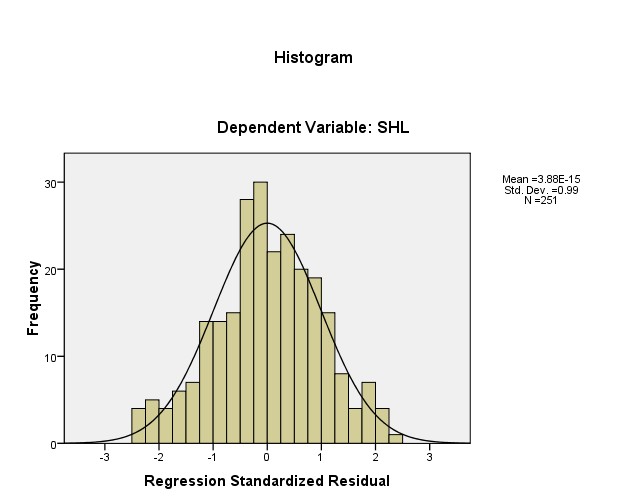
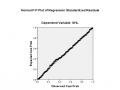
4.Kiểm định phân phối chuẩn của phần dư: