Phụ lục m- CS LẦN 2 (Tính chuyên sâu trong các lĩnh vự kiểm toán lần 2)
Cronbach's Alpha | N of Items | |||
0.872 | 3 | |||
Item-Total Statistics | ||||
Scale Mean if Item Deleted | Scale Variance if Item Deleted | Corrected Item- Total Correlation | Cronbach's Alpha if Item Deleted | |
CS1 | 8.989 | 1.611 | 0.778 | 0.799 |
CS2 | 9.018 | 1.560 | 0.780 | 0.797 |
CS3 | 9.000 | 1.673 | 0.709 | 0.861 |
Có thể bạn quan tâm!
-

 Các nhân tố ảnh hưởng đến chất lượng dịch vụ kiểm toán báo cáo tài chính của các công ty kiểm toán độc lập trên địa bàn tỉnh Bình Dương - 19
 -
 Các nhân tố ảnh hưởng đến chất lượng dịch vụ kiểm toán báo cáo tài chính của các công ty kiểm toán độc lập trên địa bàn tỉnh Bình Dương - 20
 -
 Các nhân tố ảnh hưởng đến chất lượng dịch vụ kiểm toán báo cáo tài chính của các công ty kiểm toán độc lập trên địa bàn tỉnh Bình Dương - 21
 -
 Các nhân tố ảnh hưởng đến chất lượng dịch vụ kiểm toán báo cáo tài chính của các công ty kiểm toán độc lập trên địa bàn tỉnh Bình Dương - 23
Xem toàn bộ 187 trang tài liệu này.

Phụ lục n – Kiểm định KMO
Kaiser-Meyer-Olkin Measure of Sampling Adequacy. | 0.769 | |
Bartlett's Test of Sphericity | Approx. Chi-Square | 4636.225 |
df | 595 | |
Sig. | 0.000 | |
Phụ lục o - Tổng phương sai trích của các nhân tố khám phá
Com- ponent | Initial Eigenvalues | Extraction Sums of Squared Loadings | Rotation Sums of Squared Loadings | ||||||
Total | % of Varian- ce | Cumu- lative % | Total | % of Variance | Cumu- lative % | Total | % of Varian -ce | Cumula -tive % | |
1 | 5.345 | 15.272 | 15.272 | 5.345 | 15.272 | 15.272 | 3.534 | 10.097 | 10.097 |
2 | 3.924 | 11.212 | 26.484 | 3.924 | 11.212 | 26.484 | 3.533 | 10.094 | 20.191 |
3 | 3.325 | 9.500 | 35.984 | 3.325 | 9.500 | 35.984 | 3.334 | 9.526 | 29.716 |
4 | 2.778 | 7.936 | 43.920 | 2.778 | 7.936 | 43.920 | 3.144 | 8.982 | 38.699 |
5 | 2.728 | 7.795 | 51.715 | 2.728 | 7.795 | 51.715 | 2.719 | 7.769 | 46.468 |
6 | 2.139 | 6.111 | 57.826 | 2.139 | 6.111 | 57.826 | 2.620 | 7.485 | 53.953 |
7 | 1.521 | 4.347 | 62.173 | 1.521 | 4.347 | 62.173 | 2.243 | 6.408 | 60.361 |
8 | 1.164 | 3.327 | 65.499 | 1.164 | 3.327 | 65.499 | 1.798 | 5.138 | 65.499 |
9 | 0.941 | 2.687 | 68.187 | ||||||
10 | 0.807 | 2.307 | 70.494 | ||||||
11 | 0.771 | 2.201 | 72.695 | ||||||
12 | 0.747 | 2.133 | 74.829 | ||||||
13 | 0.670 | 1.915 | 76.744 | ||||||
14 | 0.647 | 1.849 | 78.593 | ||||||
15 | 0.622 | 1.777 | 80.369 | ||||||
16 | 0.574 | 1.640 | 82.009 | ||||||
17 | 0.564 | 1.610 | 83.620 | ||||||
0.518 | 1.481 | 85.101 | |||||||
19 | 0.499 | 1.427 | 86.528 | ||||||
20 | 0.451 | 1.289 | 87.817 | ||||||
21 | 0.442 | 1.262 | 89.079 | ||||||
22 | 0.432 | 1.233 | 90.312 | ||||||
23 | 0.398 | 1.138 | 91.450 | ||||||
24 | 0.373 | 1.066 | 92.516 | ||||||
25 | 0.349 | 0.996 | 93.512 | ||||||
26 | 0.310 | 0.886 | 94.398 | ||||||
27 | 0.299 | 0.854 | 95.253 | ||||||
28 | 0.297 | 0.850 | 96.103 | ||||||
29 | 0.284 | 0.811 | 96.914 | ||||||
30 | 0.222 | 0.635 | 97.549 | ||||||
31 | 0.203 | 0.579 | 98.129 | ||||||
32 | 0.199 | 0.568 | 98.697 | ||||||
33 | 0.171 | 0.490 | 99.187 | ||||||
34 | 0.154 | 0.439 | 99.626 | ||||||
35 | 0.131 | 0.374 | 100.000 | ||||||
Extraction Method: Principal Component Analysis. | |||||||||
Phụ lục p
Component | ||||||||
1 | 2 | 3 | 4 | 5 | 6 | 7 | 8 | |
GP5 | 0.863 | |||||||
GP2 | 0.861 | |||||||
GP1 | 0.810 | |||||||
GP4 | 0.808 | |||||||
GP3 | 0.785 | |||||||
QM6 | 0.813 | |||||||
QM5 | 0.787 | |||||||
QM4 | 0.756 | |||||||
QM1 | 0.739 | |||||||
QM2 | 0.694 | |||||||
QM3 | 0.682 | |||||||
TT1 | 0.730 | |||||||
TT5 | 0.719 | |||||||
TT2 | 0.706 | |||||||
TT4 | 0.675 | |||||||
TT6 | 0.661 | |||||||
TT3 | 0.628 | |||||||
DV3 | 0.875 | |||||||
DV1 | 0.873 | |||||||
0.864 | ||||||||
DV4 | 0.844 | |||||||
KS4 | 0.862 | |||||||
KS2 | 0.802 | |||||||
KS1 | 0.776 | |||||||
KS3 | 0.752 | |||||||
CS2 | 0.872 | |||||||
CS1 | 0.863 | |||||||
CS3 | 0.840 | |||||||
NL4 | 0.770 | |||||||
NL3 | 0.763 | |||||||
NL1 | 0.687 | |||||||
NL2 | 0.665 | |||||||
NK2 | 0.796 | |||||||
NK3 | 0.743 | |||||||
NK1 | 0.663 | |||||||
Extraction Method: Principal Component Analysis. Rotation Method: Varimax with Kaiser Normalization. | ||||||||
a. Rotation converged in 6 iterations. | ||||||||
Phụ lục q – Kiểm định KMO của các nhân tố
Kaiser-Meyer-Olkin Measure of Sampling Adequacy. | 0.826 | |
Bartlett's Test of Sphericity | Approx. Chi-Square | 487.203 |
df | 6 | |
Sig. | 0.000 | |
Phụ lục r
Componen t | Initial Eigenvalues | Extraction Sums of Squared Loadings | ||||
Total | % of Variance | Cumulative % | Total | % of Variance | Cumulative % | |
1 | 2.825 | 70.636 | 70.636 | 2.825 | 70.636 | 70.636 |
2 | 0.435 | 10.864 | 81.500 | |||
3 | 0.388 | 9.709 | 91.210 | |||
4 | 0.352 | 8.790 | 100.000 | |||
Extraction Method: Principal Component Analysis. | ||||||
Phụ lục s
Component | |
1 | |
CL2 | 0.849 |
CL3 | 0.843 |
CL1 | 0.839 |
CL4 | 0.831 |
Extraction Method: Principal Component Analysis. | |
a. 1 components extracted. | |
Phụ lục t
Model | R | R Square | Adjusted R Square | Std. Error of the Estimate | Change Statistics | Durbin- Watson | ||||
R Square Change | F Change | df1 | df2 | Sig. F Change | ||||||
1 | 0.811a | 0.659 | 0.648 | 0.22612 | 0.659 | 64.357 | 8 | 267 | 0.000 | 2.053 |
a. Predictors: (Constant), TT, GP, PV, NL, KS, NK, QM, CS | ||||||||||
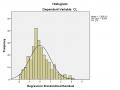
b. Dependent Variable: CL | ||||||||||
Phụ lục u
Model | Unstandar- dized Coefficients | Standar- dized Coefficients | t | Sig. | 95.0% Confidence Interval for B | Correlations | Collinearity Statistics | ||||||
B | Std. Error | Beta | Lower Bound | Upper Bound | Zero- order | Partial | Part | Toler -ance | VIF | ||||
1 | (Cons -tant) | -2.823 | 0.294 | -9.596 | .000 | -3.402 | -2.244 | ||||||
QM | 0.106 | 0.025 | 0.163 | 4.209 | 0.000 | 0.056 | 0.155 | 0.359 | 0.249 | 0.151 | 0.854 | 1.171 | |
GP | 0.151 | 0.038 | 0.148 | 4.022 | 0.000 | 0.077 | 0.225 | 0.259 | 0.239 | 0.144 | 0.950 | 1.052 | |
NK | 0.167 | 0.027 | 0.240 | 6.206 | 0.000 | 0.114 | 0.220 | 0.426 | 0.355 | 0.222 | 0.852 | 1.173 | |
DV | 0.064 | 0.031 | 0.077 | 2.055 | 0.041 | 0.003 | 0.125 | 0.168 | 0.125 | 0.073 | 0.901 | 1.110 | |
CS | 0.072 | 0.031 | 0.095 | 2.338 | 0.020 | 0.011 | 0.133 | 0.265 | 0.142 | 0.084 | 0.773 | 1.294 | |
KS | 0.070 | 0.025 | 0.108 | 2.839 | 0.005 | 0.021 | 0.118 | 0.299 | 0.171 | 0.102 | 0.879 | 1.138 | |
NL | 0.158 | 0.028 | 0.212 | 5.700 | 0.000 | 0.104 | 0.213 | 0.320 | 0.329 | 0.204 | 0.923 | 1.084 | |
TT | 0.683 | 0.071 | 0.445 | 9.580 | 0.000 | 0.543 | 0.824 | 0.721 | 0.506 | 0.343 | 0.591 | 1.691 | |
a. Dependent Variable: CL | |||||||||||||