Initial Eigenvalues | Rotation Sums of Squared Loadings | |||||
Total | % of Variance | Cumulative % | Total | % of Variance | Cumulative % | |
1 | 16.756 | 57.778 | 57.778 | 5.690 | 19.621 | 19.621 |
2 | 1.698 | 5.857 | 63.634 | 3.990 | 13.759 | 33.379 |
3 | 1.363 | 4.698 | 68.333 | 3.881 | 13.382 | 46.761 |
4 | 1.012 | 3.490 | 71.823 | 3.645 | 12.570 | 59.331 |
5 | .777 | 2.680 | 74.503 | 2.785 | 9.605 | 68.936 |
6 | .704 | 2.429 | 76.932 | 2.319 | 7.996 | 76.932 |
7 | .625 | 2.154 | 79.086 | |||
8 | .505 | 1.742 | 80.828 | |||
9 | .478 | 1.648 | 82.476 | |||
10 | .464 | 1.602 | 84.078 | |||
11 | .453 | 1.562 | 85.640 | |||
12 | .394 | 1.359 | 86.999 | |||
13 | .367 | 1.265 | 88.263 | |||
14 | .340 | 1.172 | 89.435 | |||
15 | .317 | 1.093 | 90.528 | |||
16 | .289 | .996 | 91.524 | |||
17 | .267 | .921 | 92.445 | |||
18 | .262 | .902 | 93.347 | |||
19 | .254 | .877 | 94.225 | |||
20 | .233 | .803 | 95.028 | |||
21 | .226 | .780 | 95.808 | |||
22 | .210 | .726 | 96.533 | |||
23 | .187 | .645 | 97.178 | |||
24 | .164 | .564 | 97.742 | |||
25 | .160 | .552 | 98.294 | |||
26 | .151 | .519 | 98.813 | |||
27 | .123 | .423 | 99.236 | |||
28 | .114 | .394 | 99.630 | |||
29 | .107 | .370 | 100.000 |
Có thể bạn quan tâm!
-

 Bảo Việt; 2. Bảo Hiểm Dầu Khí (Pvi); 3. Bảo Minh; 4. Bảo Hiểm Xăng Dầu (Pjico); 5. Bảo Hiểm Bưu Điện (Pti); 6. Khác
 -
 Hướng Dẫn Thực Hiện Phỏng Vấn Bán Cấu Trúc
 -
 Phát triển hoạt động bảo hiểm phi nhân thọ tại Việt Nam - 22
 -
 Phát triển hoạt động bảo hiểm phi nhân thọ tại Việt Nam - 24
 -
 Phát triển hoạt động bảo hiểm phi nhân thọ tại Việt Nam - 25
Xem toàn bộ 203 trang tài liệu này.
Extraction Method: Principal Component Analysis.
Rotated Component Matrixa
Component | ||||||
1 | 2 | 3 | 4 | 5 | 6 | |
REL2 | .814 | |||||
REL1 | .797 | |||||
REL3 | .738 | |||||
RES2 | .709 | |||||
REL4 | .681 | |||||
RES1 | .668 |
.569 | ||||||
TAN2 | .821 | |||||
TAN1 | .741 | |||||
TAN4 | .733 | |||||
TAN3 | .688 | |||||
EMP2 | .777 | |||||
EMP3 | .750 | |||||
EMP4 | .694 | |||||
EMP1 | .684 | |||||
EMP5 | .627 | |||||
IMA3 | .793 | |||||
IMA5 | .730 | |||||
IMA4 | .662 | |||||
IMA2 | .596 | |||||
IMA1 | .556 | |||||
ASS3 | .644 | |||||
AAS2 | .643 | |||||
ASS1 | .639 | |||||
ASS4 | .545 | |||||
RES4 | ||||||
PRI2 | .693 | |||||
PRI1 | .671 | |||||
PRI3 | .592 |
Extraction Method: Principal Component Analysis. Rotation Method: Varimax with Kaiser Normalization.
a. Rotation converged in 7 iterations.
Kaiser-Meyer-Olkin Measure of Sampling Adequacy.
Approx. Chi-Square
Bartlett's Test of
Sphericity
df
Sig.
.955
7273.129
378
.000
KMO and Bartlett's Test
Initial Eigenvalues | Rotation Sums of Squared Loadings | |||||
Total | % of Variance | Cumulative % | Total | % of Variance | Cumulative % | |
1 | 16.130 | 57.605 | 57.605 | 5.632 | 20.113 | 20.113 |
2 | 1.696 | 6.059 | 63.664 | 3.848 | 13.741 | 33.854 |
3 | 1.345 | 4.804 | 68.468 | 3.835 | 13.698 | 47.552 |
4 | 1.000 | 3.573 | 72.041 | 3.661 | 13.075 | 60.627 |
5 | .768 | 2.744 | 74.785 | 2.447 | 8.741 | 69.368 |
6 | .704 | 2.513 | 77.298 | 2.220 | 7.929 | 77.298 |
7 | .579 | 2.068 | 79.366 | |||
8 | .504 | 1.802 | 81.168 | |||
9 | .474 | 1.694 | 82.861 | |||
10 | .462 | 1.648 | 84.510 | |||
11 | .429 | 1.531 | 86.040 | |||
12 | .390 | 1.391 | 87.432 | |||
13 | .357 | 1.273 | 88.705 | |||
14 | .321 | 1.147 | 89.852 | |||
15 | .298 | 1.063 | 90.915 | |||
16 | .288 | 1.030 | 91.945 | |||
17 | .266 | .949 | 92.895 | |||
18 | .258 | .921 | 93.815 | |||
19 | .248 | .887 | 94.702 | |||
20 | .231 | .826 | 95.529 | |||
21 | .223 | .795 | 96.324 | |||
22 | .194 | .692 | 97.015 | |||
23 | .168 | .598 | 97.614 | |||
24 | .161 | .577 | 98.191 | |||
25 | .152 | .544 | 98.735 | |||
26 | .123 | .439 | 99.174 | |||
27 | .121 | .433 | 99.607 | |||
28 | .110 | .393 | 100.000 |
Extraction Method: Principal Component Analysis
Component | ||||||
1 | 2 | 3 | 4 | 5 | 6 | |
REL2 | .812 | |||||
REL1 | .799 | |||||
REL3 | .739 | |||||
RES2 | .715 | |||||
REL4 | .682 | |||||
RES1 | .675 | |||||
RES3 | .578 | |||||
TAN2 | .822 | |||||
TAN1 | .739 | |||||
TAN4 | .736 | |||||
TAN3 | .691 | |||||
EMP2 | .778 | |||||
EMP3 | .751 | |||||
EMP4 | .695 | |||||
EMP1 | .687 | |||||
EMP5 | .627 | |||||
IMA3 | .789 | |||||
IMA5 | .730 | |||||
IMA4 | .663 | |||||
IMA2 | .602 | |||||
IMA1 | .573 | |||||
ASS3 | .641 | |||||
AAS2 | .640 | |||||
ASS1 | .595 | |||||
ASS4 | .531 | |||||
PRI2 | .693 | |||||
PRI1 | .673 | |||||
PRI3 | .596 |
Extraction Method: Principal Component Analysis. Rotation Method: Varimax with Kaiser Normalization.
a. Rotation converged in 6 iterations.
Kaiser-Meyer-Olkin Measure of Sampling Adequacy.
Approx. Chi-Square
Bartlett's Test of
Sphericity
df
Sig.
.888
992.027
10
.000
Total Variance Explained
Initial Eigenvalues | Extraction Sums of Squared Loadings | |||||
Total | % of Variance | Cumulative % | Total | % of Variance | Cumulative % | |
1 | 3.761 | 75.213 | 75.213 | 3.761 | 75.213 | 75.213 |
2 | .414 | 8.273 | 83.486 | |||
3 | .329 | 6.584 | 90.070 | |||
4 | .282 | 5.643 | 95.713 | |||
5 | .214 | 4.287 | 100.000 |
Extraction Method: Principal Component Analysis.
Component Matrixa
Component | |
1 | |
SAT2 | .890 |
SAT3 | .885 |
SAT1 | .873 |
SAT5 | .854 |
SAT4 | .833 |
Extraction Method: Principal Component Analysis.
a. 1 components extracted.
Kaiser-Meyer-Olkin Measure of Sampling Adequacy.
Approx. Chi-Square
Bartlett's Test of
Sphericity
df
Sig.
.889
1082.600
10
.000
KMO and Bartlett's Test
Initial Eigenvalues | Extraction Sums of Squared Loadings | |||||
Total | % of Variance | Cumulative % | Total | % of Variance | Cumulative % | |
1 | 3.848 | 76.953 | 76.953 | 3.848 | 76.953 | 76.953 |
2 | .380 | 7.610 | 84.563 | |||
3 | .308 | 6.158 | 90.721 | |||
4 | .265 | 5.300 | 96.021 | |||
5 | .199 | 3.979 | 100.000 |
Componen t
Extraction Method: Principal Component Analysis.
Component Matrixa
Component | |
1 | |
LOY2 | .898 |
LOY4 | .895 |
LOY3 | .870 |
LOY5 | .869 |
LOY1 | .853 |
Extraction Method: Principal Component Analysis.
a. 1 components extracted.
3. Phân tích tương quan
Correlations
RLS | ASS | EMP | TAN | IMA | PRI | SAT | LOY | ||
RLS ASS EMP TAN | Pearson Correlation Sig. (2-tailed) N Pearson Correlation Sig. (2-tailed) N Pearson Correlation Sig. (2-tailed) N Pearson Correlation Sig. (2-tailed) N | 1 | .793** | .720* * | .630* * | .712* * | .752* * | .776* * | .777** |
.000 | .000 | .000 | .000 | .000 | .000 | .000 | |||
297 .793* * | 297 1 | 297 .722* * | 297 .701* * | 297 .735* * | 297 .754* * | 297 .768* * | 297 .702** | ||
.000 | .000 | .000 | .000 | .000 | .000 | .000 | |||
297 .720* * | 297 .722** | 297 1 | 297 .632* * | 297 .738* * | 297 .682* * | 297 .702* * | 297 .730** | ||
.000 | .000 | .000 | .000 | .000 | .000 | .000 | |||
297 .630* * | 297 .701** | 297 .632* * | 297 1 | 297 .711* * | 297 .727* * | 297 .709* * | 297 .711** | ||
.000 | .000 | .000 | .000 | .000 | .000 | .000 | |||
297 | 297 | 297 | 297 | 297 | 297 | 297 | 297 |
Pearson Correlation Sig. (2-tailed) N Pearson Correlation Sig. (2-tailed) N Pearson Correlation Sig. (2-tailed) N Pearson Correlation Sig. (2-tailed) N | .712* * | .735** | .738* * | .711* * | 1 | .721* * | .720* * | .726** |
.000 | .000 | .000 | .000 | .000 | .000 | .000 | |
297 | 297 | 297 | 297 | 297 | 297 | 297 | 297 |
.752* * | .754** | .682* * | .727* * | .721* * | 1 | .787* * | .741** |
.000 | .000 | .000 | .000 | .000 | .000 | .000 | |
297 | 297 | 297 | 297 | 297 | 297 | 297 | 297 |
.776* * | .768** | .702* * | .709* * | .720* * | .787* * | 1 | .838** |
.000 | .000 | .000 | .000 | .000 | .000 | .000 | |
297 | 297 | 297 | 297 | 297 | 297 | 297 | 297 |
.777* * | .702** | .730* * | .711* * | .726* * | .741* * | .838* * | 1 |
.000 | .000 | .000 | .000 | .000 | .000 | .000 | |
297 | 297 | 297 | 297 | 297 | 297 | 297 | 297 |
**. Correlation is significant at the 0.01 level (2-tailed).
4. Phân tích hồi quy
Model Summaryb
R | R Square | Adjusted R Square | Std. Error of the Estimate | Durbin- Watson | |
1 | .858a | .736 | .731 | .41698 | 1.645 |
a. Predictors: (Constant), PRI, EMP, TAN, RLS, IMA, ASS
b. Dependent Variable: SAT
ANOVAa
Sum of Squares | df | Mean Square | F | Sig. | ||
1 | Regression Residual Total | 140.583 | 6 | 23.430 | 134.759 | .000b |
50.422 | 290 | .174 | ||||
191.005 | 296 |
a. Dependent Variable: SAT
b. Predictors: (Constant), PRI, EMP, TAN, RLS, IMA, ASS
Coefficientsa
Unstandardized Coefficients | Standardized Coefficients | t | Sig. | Collinearity Statistics | ||||
B | Std. Error | Beta | Tolerance | VIF | ||||
(Constant) | .320 | .120 | 2.674 | .008 | ||||
RLS | .233 | .052 | .251 | 4.471 | .000 | .289 | 3.457 | |
ASS | .143 | .056 | .149 | 2.554 | .011 | .267 | 3.739 | |
1 | EMP | .078 | .046 | .086 | 1.698 | .091 | .357 | 2.801 |
TAN | .137 | .046 | .145 | 2.960 | .003 | .379 | 2.636 | |
IMA | .067 | .053 | .068 | 1.262 | .208 | .313 | 3.195 | |
PRI | .242 | .049 | .273 | 4.962 | .000 | .300 | 3.331 |
a. Dependent Variable: SAT
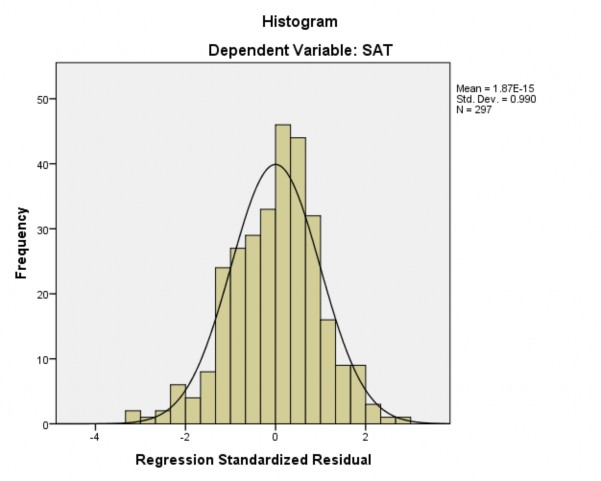
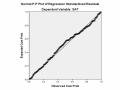
- Kiểm tra các khuyết tật mô hình