Model Summaryb
R | R Square | Adjusted R Square | Std. Error of the Estimate | Durbin- Watson | |
1 | .838a | .702 | .701 | .44817 | 1.749 |
Có thể bạn quan tâm!
-

 Hướng Dẫn Thực Hiện Phỏng Vấn Bán Cấu Trúc
 -
 Phát triển hoạt động bảo hiểm phi nhân thọ tại Việt Nam - 22
 -
 Phát triển hoạt động bảo hiểm phi nhân thọ tại Việt Nam - 23
 -
 Phát triển hoạt động bảo hiểm phi nhân thọ tại Việt Nam - 25
Xem toàn bộ 203 trang tài liệu này.
a. Predictors: (Constant), SAT
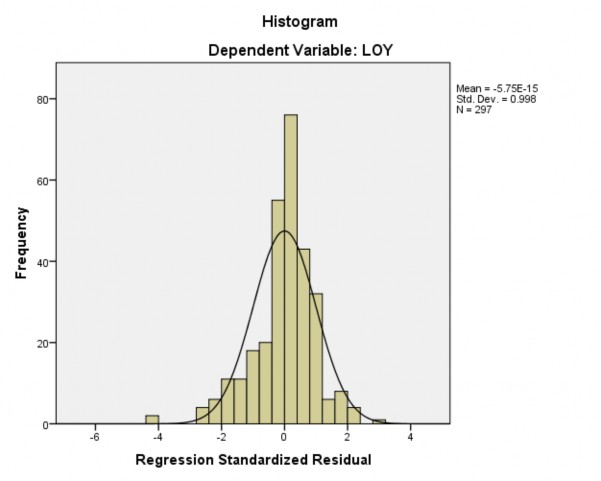
b. Dependent Variable: LOY
ANOVAa
Sum of Squares | df | Mean Square | F | Sig. | ||
1 | Regression Residual Total | 139.876 | 1 | 139.876 | 696.387 | .000b |
59.254 | 295 | .201 | ||||
199.130 | 296 |
a. Dependent Variable: LOY
b. Predictors: (Constant), SAT
Coefficientsa
Unstandardized Coefficients | Standardized Coefficients | t | Sig. | Collinearity Statistics | ||||
B | Std. Error | Beta | Tolerance | VIF | ||||
1 | (Constant) SAT | .441 | .118 | 3.745 | .000 | |||
.856 | .032 | .838 | 26.389 | .000 | 1.000 | 1.000 |
a. Dependent Variable: LOY
5. Kiểm định tính phù hợp tổng thể bằng Bootstrap
Với mẫu có hoàn lại 500
Bootstrap for Coefficients
B | Bootstrapa | |||||
Bias | Std. Error | Sig. (2-tailed) | 95% Confidence Interval | |||
Lower | Upper | |||||
(Constant ) RLS ASS 1 EMP TAN IMA PRI | .320 .233 .143 .078 .137 .067 .242 | -.001 -.005 .002 .006 .000 .003 -.004 | .136 .074 .076 .048 .059 .067 .062 | .012 .002 .066 .110 .020 .327 .002 | .036 .083 -.008 -.007 .024 -.053 .117 | .582 .382 .287 .180 .252 .211 .359 |
a. Unless otherwise noted, bootstrap results are based on 500 bootstrap samples Với mẫu có hoàn lại 1000
Bootstrap for Coefficients
B | Bootstrapa | |||||
Bias | Std. Error | Sig. (2- tailed) | 95% Confidence Interval | |||
Lower | Upper | |||||
(Constant ) RLS ASS 1 EMP TAN IMA PRI | .320 .233 .143 .078 .137 .067 .242 | .003 -.002 .003 .000 .002 .003 -.005 | .136 .072 .070 .048 .057 .067 .061 | .023 .003 .043 .114 .024 .324 .001 | .057 .086 .006 -.010 .024 -.059 .121 | .603 .367 .279 .177 .248 .206 .365 |
a. Unless otherwise noted, bootstrap results are based on 1000 bootstrap samples
6. Mã hóa các nhân tố từ năm mức độ về 3 mức độ và tính thống kê mô tả
ReRLS
Frequenc y | Percent | Valid Percent | Cumulative Percent | ||
1.00 | 48 | 16.2 | 16.2 | 16.2 | |
Valid | 2.00 3.00 | 21 228 | 7.1 76.8 | 7.1 76.8 | 23.2 100.0 |
Total | 297 | 100.0 | 100.0 |
ReASS
Frequency | Percent | Valid Percent | Cumulative Percent | ||
1.00 | 37 | 12.5 | 12.5 | 12.5 | |
Valid | 2.00 3.00 | 27 233 | 9.1 78.5 | 9.1 78.5 | 21.5 100.0 |
Total | 297 | 100.0 | 100.0 |
ReEMP
Frequency | Percent | Valid Percent | Cumulative Percent | ||
1.00 | 56 | 18.9 | 18.9 | 18.9 | |
Valid | 2.00 3.00 | 28 213 | 9.4 71.7 | 9.4 71.7 | 28.3 100.0 |
Total | 297 | 100.0 | 100.0 |
ReTAN
Frequency | Percent | Valid Percent | Cumulative Percent | ||
1.00 | 49 | 16.5 | 16.5 | 16.5 | |
Valid | 2.00 3.00 | 41 207 | 13.8 69.7 | 13.8 69.7 | 30.3 100.0 |
Total | 297 | 100.0 | 100.0 |
ReIMA
Frequency | Percent | Valid Percent | Cumulative Percent | ||
1.00 | 30 | 10.1 | 10.1 | 10.1 | |
Valid | 2.00 3.00 | 29 238 | 9.8 80.1 | 9.8 80.1 | 19.9 100.0 |
Total | 297 | 100.0 | 100.0 |
RePRI
Frequency | Percent | Valid Percent | Cumulative Percent | ||
1.00 | 40 | 13.5 | 13.5 | 13.5 | |
Valid | 2.00 3.00 | 47 210 | 15.8 70.7 | 15.8 70.7 | 29.3 100.0 |
Total | 297 | 100.0 | 100.0 |
ReSAT
Frequenc y | Percent | Valid Percent | Cumulative Percent | ||
1.00 | 41 | 13.8 | 13.8 | 13.8 | |
Valid | 2.00 3.00 | 33 223 | 11.1 75.1 | 11.1 75.1 | 24.9 100.0 |
Total | 297 | 100.0 | 100.0 |
ReLOY
Frequenc y | Percent | Valid Percent | Cumulative Percent | ||
1.00 | 42 | 14.1 | 14.1 | 14.1 | |
Valid | 2.00 3.00 | 37 218 | 12.5 73.4 | 12.5 73.4 | 26.6 100.0 |
Total | 297 | 100.0 | 100.0 |
7. Các phân tích khác biệt theo nhóm bằng T-test và ANOVA
Group Statistics
Q3 | N | Mean | Std. Deviation | Std. Error Mean | |
Cá nhân LOY Doanh nghi?p | 216 80 | 3.4998 3.3950 | .79328 .89385 | .05398 .09994 | |
Independent Samples Test
Levene's Test for Equality of Variances | t-test for Equality of Means | ||||||||
F | Sig. | t | df | Sig. (2- tail ed) | Mean Difference | Std. Error Difference | 95% Confidence Interval of the Difference | ||
Lower | Upper | ||||||||
Equal variances assumed LO Y Equal variances not assumed | 1.469 | .226 | .974 .922 | 294 127. 817 | .33 1 .35 8 | .10477 .10477 | .10752 .11358 | -.10684 -.11997 | .31637 .32951 |
ANOVA
LOY
Sum of Squares | df | Mean Square | F | Sig. | |
Between Groups | 4.017 | 2 | 2.008 | 3.026 | .050 |
Within Groups | 195.113 | 294 | .664 | ||
Total | 199.130 | 296 |
Group Statistics
Q5 | N | Mean | Std. Deviation | Std. Error Mean | |
T? LOY nguy?n B?t bu?c | 209 86 | 3.4990 3.3727 | .75216 .95436 | .05203 .10291 | |
Q6 | N | Mean | Std. Deviation | Std. Error Mean | |
Ch?a ???c b?i LOY th??ng ???c b?i th??ng | 181 116 | 3.4218 3.5466 | .85297 .76368 | .06340 .07091 | |