.772 | ||
Chi phi phu hop voi kha nang chi tra | .762 | |
Chi phi cho tai lieu la chap nhan duoc | .646 | |
phuong phap giang day hieu qua | .856 | |
giao vien nhiet tinh vui ve | .823 | |
giao vien co trinh do chuyen mon cao | .789 |
Có thể bạn quan tâm!
-

 Bảng Hỏi Khảo Sát Ý Kiến Học Viên Về Nhu Cầu Lựa Chọn Khóa Học Kế Toán Tại Trung Tâm Đào Tạo Và Tư Vấn Hồng Đức
 -
 Nghiên cứu các yếu tố ảnh hưởng đến quyết định lựa chọn các khóa học kế toán của học viên tại Trung tâm Đào tạo và Tư vấn Hồng Đức tại Thành phố Huế - 12
 -
 Nghiên cứu các yếu tố ảnh hưởng đến quyết định lựa chọn các khóa học kế toán của học viên tại Trung tâm Đào tạo và Tư vấn Hồng Đức tại Thành phố Huế - 13
Xem toàn bộ 115 trang tài liệu này.
Extraction Method: Principal Component Analysis. Rotation Method: Varimax with Kaiser Normalization.
a. Rotation converged in 6 iterations.
5.2 Phân tích nhân tố khám phá đối với biến phụ thuộc “Quyết định cá nhân”
KMO and Bartlett's Test
.678 | |
Approx. Chi-Square | 88.555 |
Bartlett's Test of Sphericity df | 3 |
Sig. | .000 |
Total Variance Explained
Initial | Eigenvalues | Extraction Sums of Squared Loadings | ||||
Total | % of Variance | Cumulative % | Total | % of Variance | Cumulative % | |
1 | 1.931 | 64.379 | 64.379 | 1.931 | 64.379 | 64.379 |
2 | .577 | 19.235 | 83.614 | |||
3 | .492 | 16.386 | 100.000 |
Extraction Method: Principal Component Analysis.
6. Phân tích tương quan pearson – r
Correlations
CP | DNGV | NTK | LI | TH | TT | QD | ||
Pearson Correlation | 1 | .160 | .054 | .106 | .125 | .074 | .277** | |
CP | Sig. (2-tailed) | .051 | .512 | .197 | .128 | .365 | .001 | |
N | 150 | 150 | 150 | 150 | 150 | 150 | 150 | |
Pearson Correlation | .160 | 1 | .185* | .157 | .173* | .381** | .471** | |
DNGV | Sig. (2-tailed) | .051 | .023 | .055 | .034 | .000 | .000 | |
N | 150 | 150 | 150 | 150 | 150 | 150 | 150 | |
Pearson Correlation | .054 | .185* | 1 | .302** | .429** | .354** | .464** | |
NTK | Sig. (2-tailed) | .512 | .023 | .000 | .000 | .000 | .000 | |
N | 150 | 150 | 150 | 150 | 150 | 150 | 150 | |
Pearson Correlation | .106 | .157 | .302** | 1 | .349** | .354** | .491** | |
LI | Sig. (2-tailed) | .197 | .055 | .000 | .000 | .000 | .000 | |
N | 150 | 150 | 150 | 150 | 150 | 150 | 150 | |
Pearson Correlation | .125 | .173* | .429** | .349** | 1 | .318** | .439** | |
TH | Sig. (2-tailed) | .128 | .034 | .000 | .000 | .000 | .000 | |
N | 150 | 150 | 150 | 150 | 150 | 150 | 150 | |
Pearson Correlation | .074 | .381** | .354** | .354** | .318** | 1 | .530** | |
TT | Sig. (2-tailed) | .365 | .000 | .000 | .000 | .000 | .000 | |
N | 150 | 150 | 150 | 150 | 150 | 150 | 150 | |
Pearson Correlation | .277** | .471** | .464** | .491** | .439** | .530** | 1 | |
QD | Sig. (2-tailed) | .001 | .000 | .000 | .000 | .000 | .000 | |
N | 150 | 150 | 150 | 150 | 150 | 150 | 150 |
**. Correlation is significant at the 0.01 level (2-tailed).
*. Correlation is significant at the 0.05 level (2-tailed).
7. Phân tích hồi quy đa biến
- Mô hình hồi quy tóm tắt
Model Summaryb
R | R Square | Adjusted R Square | Std. Error of the Estimate | Durbin-Watson | |
1 | .746a | .557 | .538 | .33153 | 1.856 |
a. Predictors: (Constant), TT, CP, TH, DNGV, LI, NTK
b. Dependent Variable: QD
- Bảng phân tích ANOVA
ANOVAa
Sum of Squares | df | Mean Square | F | Sig. | ||
Regression | 19.765 | 6 | 3.294 | 29.971 | .000b | |
1 | Residual | 15.717 | 143 | .110 | ||
Total | 35.481 | 149 |
a. Dependent Variable: QD
b. Predictors: (Constant), TT, CP, TH, DNGV, LI, NTK
- Kết quả phân tích hồi quy đa biến
Coefficientsa
Unstandardized Coefficients | Standardized Coefficients | t | Sig. | Collinearity | Statistics | |||
B | Std. Error | Beta | Tolerance | VIF | ||||
(Constant) | -.084 | .317 | -.265 | .791 | ||||
CP | .148 | .051 | .165 | 2.909 | .004 | .961 | 1.041 | |
DNGV | .175 | .041 | .263 | 4.315 | .000 | .834 | 1.199 | |
1 | NTK | .158 | .051 | .198 | 3.081 | .002 | .751 | 1.332 |
LI | .203 | .051 | .250 | 4.007 | .000 | .799 | 1.252 | |
TH | .115 | .056 | .132 | 2.042 | .043 | .743 | 1.347 | |
TT | .182 | .055 | .217 | 3.291 | .001 | .711 | 1.407 |
a. Dependent Variable: QD
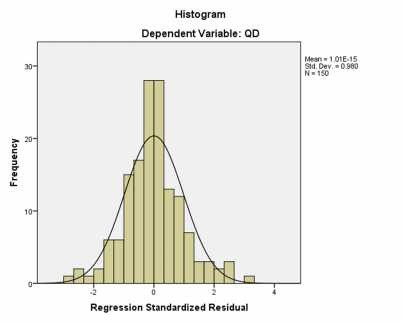
- Kiểm định phân phối chuẩn của phần dư