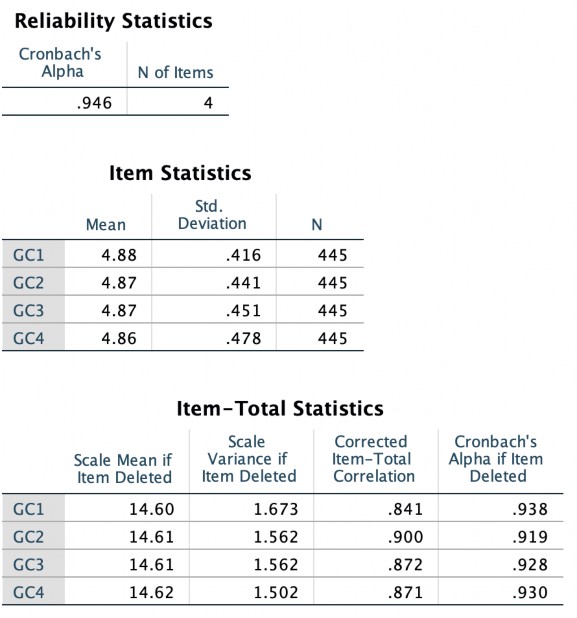
Giá cảm nhận

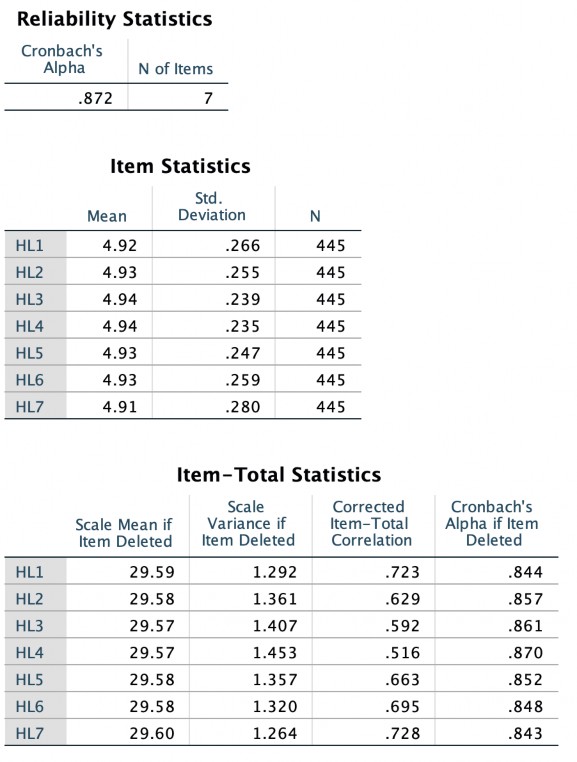
Mức độ hài lòng của khách hang

Phân tích nhân tố khám phá Nhân tố tác động
Kaiser-Meyer-Olkin Measure of Sampling Adequacy. | .881 | |
Bartlett's Test of Sphericity | Approx. Chi-Square | 9218.494 |
df | 351 | |
Sig. | .000 | |
Có thể bạn quan tâm!
-
 Nâng cao chất lượng dịch vụ khách sạn phục vụ khách du lịch đến Bà Rịa – Vũng Tàu - 10
 -
 Danh Sách Chuyên Gia Trong Thảo Luận Nhóm
 -
 Nâng cao chất lượng dịch vụ khách sạn phục vụ khách du lịch đến Bà Rịa – Vũng Tàu - 12
 -
 Nâng cao chất lượng dịch vụ khách sạn phục vụ khách du lịch đến Bà Rịa – Vũng Tàu - 14
Xem toàn bộ 119 trang tài liệu này.

Rotated Component Matrixa
Component | ||||||
1 | 2 | 3 | 4 | 5 | 6 | |
VC5 | .901 | |||||
VC4 | .886 | |||||
VC2 | .865 | |||||
VC3 | .857 |
.854 | ||||||
TC5 | .832 | |||||
TC1 | .814 | |||||
TC4 | .793 | .307 | ||||
TC3 | .789 | |||||
TC2 | .785 | |||||
GC2 | .925 | |||||
GC4 | .906 | |||||
GC3 | .902 | |||||
GC1 | .885 | |||||
PV1 | .859 | |||||
PV3 | .840 | |||||
PV4 | .320 | .821 | ||||
PV2 | .350 | .802 | ||||
DU3 | .792 | |||||
DU5 | .788 | |||||
DU2 | .743 | |||||
DU1 | .726 | |||||
DU4 | .715 | |||||
DC4 | .801 | |||||
DC1 | .768 | |||||
DC2 | .720 | |||||
DC3 | .619 |
Extraction Method: Principal Component Analysis. Rotation Method: Varimax with Kaiser Normalization.
a. Rotation converged in 6 iterations.
Nhân tố bị tác động
KMO and Bartlett's Test
.857 | ||
Bartlett's Test of Sphericity | Approx. Chi-Square | 1409.903 |
df | 21 | |
Sig. | .000 |
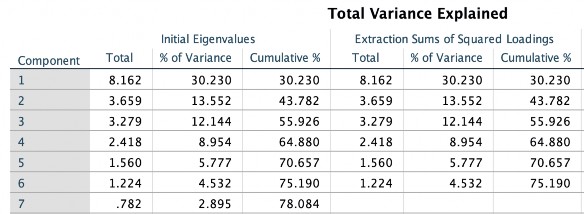
Total Variance Explained
Initial Eigenvalues | Extraction Sums of Squared Loadings | |||||
Total | % of Variance | Cumulative % | Total | % of Variance | Cumulative % | |
1 | 3.970 | 56.711 | 56.711 | 3.970 | 56.711 | 56.711 |
2 | .862 | 12.316 | 69.027 | |||
3 | .643 | 9.179 | 78.206 | |||
4 | .537 | 7.672 | 85.878 | |||
5 | .385 | 5.496 | 91.374 | |||
6 | .338 | 4.825 | 96.199 |
.266 | 3.801 | 100.000 |
Extraction Method: Principal Component Analysis.
Component Matrixa
Componen t
1
.819 | |
HL1 | .813 |
HL6 | .790 |
HL5 | .767 |
HL2 | .733 |
HL3 | .704 |
HL4 | .626 |
Extraction Method: Principal Component Analysis.
a. 1 components extracted.
Hồi quy
Correlations
DU | PV | TC | DC | VC | GC | HL |
Pearson Correlation | 1 | .377** | .344** | -.204** | .150** | .222** | .604** | |
Sig. (2-tailed) | .000 | .000 | .000 | .002 | .000 | .000 | ||
N | 445 | 445 | 445 | 445 | 445 | 445 | 445 | |
PV | Pearson Correlation | .377** | 1 | .617** | .027 | .234** | .229** | .292** |
Sig. (2-tailed) | .000 | .000 | .571 | .000 | .000 | .000 | ||
N | 445 | 445 | 445 | 445 | 445 | 445 | 445 | |
TC | Pearson Correlation | .344** | .617** | 1 | .237** | .348** | .352** | .341** |
Sig. (2-tailed) | .000 | .000 | .000 | .000 | .000 | .000 | ||
N | 445 | 445 | 445 | 445 | 445 | 445 | 445 | |
DC | Pearson Correlation | -.204** | .027 | .237** | 1 | .180** | .175** | .006 |
Sig. (2-tailed) | .000 | .571 | .000 | .000 | .000 | .907 | ||
N | 445 | 445 | 445 | 445 | 445 | 445 | 445 | |
VC | Pearson Correlation | .150** | .234** | .348** | .180** | 1 | .066 | .459** |
Sig. (2-tailed) | .002 | .000 | .000 | .000 | .163 | .000 | ||
N | 445 | 445 | 445 | 445 | 445 | 445 | 445 | |
GC | Pearson Correlation | .222** | .229** | .352** | .175** | .066 | 1 | .212** |
Sig. (2-tailed) | .000 | .000 | .000 | .000 | .163 | .000 | ||
N | 445 | 445 | 445 | 445 | 445 | 445 | 445 | |
HL | Pearson Correlation | .604** | .292** | .341** | .006 | .459** | .212** | 1 |
Sig. (2-tailed) | .000 | .000 | .000 | .907 | .000 | .000 | ||
N | 445 | 445 | 445 | 445 | 445 | 445 | 445 |
**. Correlation is significant at the 0.01 level (2-tailed).
Model Summary
R | R Square | Adjusted R Square | Std. Error of the Estimate | |
1 | .714a | .510 | .504 | .135022061 917689 |
a. Predictors: (Constant), GC, VC, DC, PV, DU, TC
ANOVAa
Sum of Squares | df | Mean Square | F | Sig. | ||
1 | Regressio n | 8.325 | 6 | 1.387 | 76.104 | .000b |
Residual | 7.985 | 438 | .018 | |||
Total | 16.310 | 444 |
a. Dependent Variable: HL
b. Predictors: (Constant), GC, VC, DC, PV, DU, TC
Coefficientsa
Unstandardized Coefficients | Standardized Coefficients | t | Sig. | Collinearity Statistics | ||||
B | Std. Error | Beta | Tolerance | VIF | ||||
1 | (Constant) | 1.762 | .183 | 9.653 | .000 | |||
DU | .351 | .025 | .549 | 14.179 | .000 | .745 | 1.342 |


