Phụ lục 2.7: Kết quả phân tích tương quan và hồi quy
Correlations
F_HU | F_GC | F_NV | F_BH | F_TT | F_CLDV | ||
F_HU F_GC F_NV F_BH F_TT F_CLD V | Pearson Correlation Sig. (2-tailed) N Pearson Correlation Sig. (2-tailed) N Pearson Correlation Sig. (2-tailed) N Pearson Correlation Sig. (2-tailed) N Pearson Correlation Sig. (2-tailed) N Pearson Correlation Sig. (2-tailed) N | 1 | .074 | .440** | .511** | .013 | .690** |
.363 | .000 | .000 | .873 | .000 | |||
155 | 155 | 155 | 155 | 155 | 155 | ||
.074 | 1 | .076 | .090 | .187* | .240** | ||
.363 | .345 | .268 | .020 | .003 | |||
155 | 155 | 155 | 155 | 155 | 155 | ||
.440** | .076 | 1 | .510** | .089 | .546** | ||
.000 | .345 | .000 | .273 | .000 | |||
155 | 155 | 155 | 155 | 155 | 155 | ||
.511** | .090 | .510** | 1 | .138 | .576** | ||
.000 | .268 | .000 | .087 | .000 | |||
155 | 155 | 155 | 155 | 155 | 155 | ||
.013 | .187* | .089 | .138 | 1 | .214** | ||
.873 | .020 | .273 | .087 | .008 | |||
155 | 155 | 155 | 155 | 155 | 155 | ||
.690** | .240** | .546** | .576** | .214** | 1 | ||
.000 | .003 | .000 | .000 | .008 | |||
155 | 155 | 155 | 155 | 155 | 155 |
Có thể bạn quan tâm!
-

 Kết Quả Thống Kê Mô Tả Đặc Điểm Mẫu
 -
 Nâng cao chất lượng dịch vụ của rạp chiếu phim Cinestar Huế - 11
 -
 Nâng cao chất lượng dịch vụ của rạp chiếu phim Cinestar Huế - 12
Xem toàn bộ 109 trang tài liệu này.
**. Correlation is significant at the 0.01 level (2-tailed).
*. Correlation is significant at the 0.05 level (2-tailed).
Model Summaryb
R | R Square | Adjusted R Square | Std. Error of the Estimate | Durbin-Watson | |
1 | .790a | .625 | .612 | .44302 | 1.896 |
a. Predictors: (Constant), F_TT, F_HU, F_GC, F_NV, F_BH
b. Dependent Variable: F_CLDV
ANOVAa
Sum of Squares | df | Mean Square | F | Sig. | ||
Regression | 48.662 | 5 | 9.732 | 49.588 | .000b | |
1 | Residual | 29.243 | 149 | .196 | ||
Total | 77.905 | 154 |
a. Dependent Variable: F_CLDV
b. Predictors: (Constant), F_TT, F_HU, F_GC, F_NV, F_BH
Coefficientsa
Unstandardized | Coefficients | Standardized Coefficients | t | Sig. | Collinearity | Statistics | ||
B | Std. Error | Beta | Tolerance | VIF | ||||
(Constant) | -.917 | .362 | -2.534 | .012 | ||||
F_HU | .548 | .068 | .488 | 8.083 | .000 | .691 | 1.447 | |
1 | F_GC | .162 | .057 | .146 | 2.842 | .005 | .959 | 1.043 |
F_NV | .193 | .054 | .214 | 3.553 | .001 | .695 | 1.439 | |
F_BH | .184 | .063 | .186 | 2.934 | .004 | .627 | 1.595 | |
F_TT | .182 | .069 | .136 | 2.626 | .010 | .944 | 1.059 |
a. Dependent Variable: F_CLDV
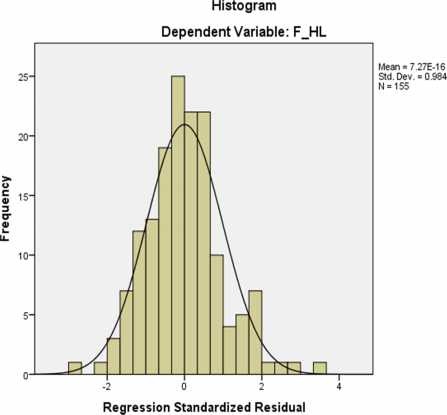
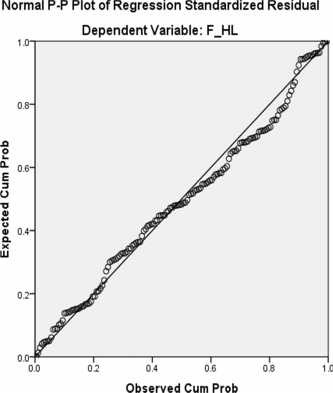
Charts
Phụ lục 2.8: Kết quả kiểm định sự khác biệt
Kiểm định sự khác biệt theo giới tính
ANOVA
F_CLDV
Sum of Squares | df | Mean Square | F | Sig. | |
Between Groups | .656 | 2 | .328 | .645 | .526 |
Within Groups | 77.249 | 152 | .508 | ||
Total | 77.905 | 154 |
Kiểm định sự khác biệt theo độ tuổi
ANOVA
F_CLDV
Sum of Squares | df | Mean Square | F | Sig. | |
Between Groups | .825 | 3 | .275 | .539 | .656 |
Within Groups | 77.079 | 151 | .510 | ||
Total | 77.905 | 154 |
Khóa luận tốt nghiệp GVHD: T.S Phan Thanh Hoàn
Kiểm định sự khác biệt theo nghề nghiệp
ANOVA
F_CLDV
Sum of Squares | df | Mean Square | F | Sig. | |
Between Groups | 3.107 | 5 | .621 | 1.238 | .294 |
Within Groups | 74.798 | 149 | .502 | ||
Total | 77.905 | 154 |
SVTH: Ngô Thị Minh Trang 91