.817 | |||||
TDTT 4 | .800 | ||||
TDTT 6 | .729 | ||||
TDTT 1 | .615 | ||||
TDTT 3 | .613 | ||||
LHM 1 | .509 | .541 | |||
Extraction Method: Principal Component Analysis. Rotation Method: Varimax with Kaiser Normalization. | |||||
a. Rotation converged in 9 iterations. | |||||
Có thể bạn quan tâm!
-
 Anh/chị Đang Gửi Tiền Tiết Kiệm Tại Ngân Hàng Sacombank Hà Tĩnh?
 -
 Anh/chị Đã Sử Dụng Dịch Vụ Tgtk Tại Sacombank Hà Tĩnh Trong Bao Lâu?
 -
 Đánh Giá Độ Tin Cậy Thang Đo Bằng Cronbach’S Alpha Trước Khi Rút Trích
 -
 Đánh giá mức độ ảnh hưởng của thương hiệu đến quyết định lựa chọn dịch vụ tiền gửi tiết kiệm tại ngân hàng TMCP Sài Gòn Thương Tín - Chi nhánh Hà Tĩnh - 15
Xem toàn bộ 123 trang tài liệu này.

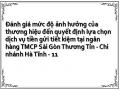
Kết quả rút trích nhân tố lần 2 KMO and Bartlett's Test
.873 | ||
Bartlett's Test of Sphericity | Approx. Chi-Square | 1.409E3 |
df | 210 | |
Sig. | .000 |
Rotated Component Matrixa
Component | |||||
1 | 2 | 3 | 4 | 5 | |
LTT 4 | .766 | ||||
LHM 2 | .756 | ||||
LTT 3 | .697 | ||||
LTT 1 | .690 | ||||
LHM 4 | .546 | ||||
NB 3 | .782 | ||||
NB 4 | .747 | ||||
NB 2 | .653 | ||||
NB 5 | .620 | ||||
NB 1 | .574 | ||||
CLCN 3 | .725 | ||||
CLCN 6 | .658 | ||||
CLCN 7 | .652 | ||||
CLCN 1 | .613 | ||||
CLCN 2 | |||||
TDTT 5 | .816 | ||||
TDTT 4 | .795 |
.738 | |||||
TDTT 1 | .664 | ||||
TDTT 3 | .629 | ||||
LHM 1 | .516 | .539 | |||
Extraction Method: Principal Component Analysis. Rotation Method: Varimax with Kaiser Normalization. | |||||
a. Rotation converged in 7 iterations. | |||||
Kết quả rút trích nhân tố lần 3 KMO and Bartlett's Test
.866 | ||
Bartlett's Test of Sphericity | Approx. Chi-Square | 1.309E3 |
df | 190 | |
Sig. | .000 |
Rotated Component Matrixa
Component | ||||
1 | 2 | 3 | 4 | |
LHM 2 | .790 | |||
LTT 4 | .757 | |||
LTT 1 | .696 | |||
LTT 3 | .680 | |||
LHM 1 | .581 | |||
LHM 4 | .572 | |||
TDTT 5 | .807 | |||
TDTT 6 | .734 | |||
TDTT 4 | .732 | |||
TDTT 1 | .673 | |||
TDTT 3 | .591 | |||
NB 3 | .759 | |||
NB 4 | .729 | |||
NB 5 | .698 | |||
NB 2 | .586 | |||
NB 1 | .521 | |||
CLCN 3 | .721 | |||
CLCN 7 | .669 | |||
CLCN 6 | .645 |
Extraction Method: Principal Component Analysis. Rotation Method: Varimax with Kaiser Normalization. | ||||
a. Rotation converged in 6 iterations. | ||||
Kết quả rút trích nhân tố lần 4 KMO and Bartlett's Test
.859 | ||
Bartlett's Test of Sphericity | Approx. Chi-Square | 1.239E3 |
df | 171 | |
Sig. | .000 |
Total Variance Explained
Initial Eigenvalues | Extraction Sums of Squared Loadings | Rotation Sums of Squared Loadings | |||||||
Total | % of Variance | Cumulative % | Total | % of Variance | Cumulative % | Total | % of Variance | Cumulative % | |
1 | 6.913 | 36.383 | 36.383 | 6.913 | 36.383 | 36.383 | 3.310 | 17.422 | 17.422 |
2 | 1.855 | 9.765 | 46.148 | 1.855 | 9.765 | 46.148 | 3.004 | 15.810 | 33.232 |
3 | 1.519 | 7.993 | 54.140 | 1.519 | 7.993 | 54.140 | 2.929 | 15.416 | 48.648 |
4 | 1.113 | 5.856 | 59.996 | 1.113 | 5.856 | 59.996 | 2.156 | 11.349 | 59.996 |
5 | .925 | 4.867 | 64.863 | ||||||
6 | .878 | 4.620 | 69.483 | ||||||
7 | .797 | 4.197 | 73.680 | ||||||
8 | .698 | 3.672 | 77.351 | ||||||
9 | .605 | 3.185 | 80.536 | ||||||
10 | .521 | 2.743 | 83.279 | ||||||
11 | .503 | 2.648 | 85.927 | ||||||
12 | .484 | 2.549 | 88.477 | ||||||
13 | .458 | 2.408 | 90.885 | ||||||
14 | .398 | 2.093 | 92.977 | ||||||
15 | .373 | 1.962 | 94.939 | ||||||
16 | .302 | 1.590 | 96.529 | ||||||
17 | .243 | 1.279 | 97.808 | ||||||
18 | .228 | 1.203 | 99.010 |
Total Variance Explained
Initial Eigenvalues | Extraction Sums of Squared Loadings | Rotation Sums of Squared Loadings | |||||||
Total | % of Variance | Cumulative % | Total | % of Variance | Cumulative % | Total | % of Variance | Cumulative % | |
1 | 6.913 | 36.383 | 36.383 | 6.913 | 36.383 | 36.383 | 3.310 | 17.422 | 17.422 |
2 | 1.855 | 9.765 | 46.148 | 1.855 | 9.765 | 46.148 | 3.004 | 15.810 | 33.232 |
3 | 1.519 | 7.993 | 54.140 | 1.519 | 7.993 | 54.140 | 2.929 | 15.416 | 48.648 |
4 | 1.113 | 5.856 | 59.996 | 1.113 | 5.856 | 59.996 | 2.156 | 11.349 | 59.996 |
5 | .925 | 4.867 | 64.863 | ||||||
6 | .878 | 4.620 | 69.483 | ||||||
7 | .797 | 4.197 | 73.680 | ||||||
8 | .698 | 3.672 | 77.351 | ||||||
9 | .605 | 3.185 | 80.536 | ||||||
10 | .521 | 2.743 | 83.279 | ||||||
11 | .503 | 2.648 | 85.927 | ||||||
12 | .484 | 2.549 | 88.477 | ||||||
13 | .458 | 2.408 | 90.885 | ||||||
14 | .398 | 2.093 | 92.977 | ||||||
15 | .373 | 1.962 | 94.939 | ||||||
16 | .302 | 1.590 | 96.529 | ||||||
17 | .243 | 1.279 | 97.808 | ||||||
18 | .228 | 1.203 | 99.010 | ||||||
19 | .188 | .990 | 100.000 | ||||||
Extraction Method: Principal Component Analysis. | |||||||||
Rotated Component Matrixa
Component | ||||
1 | 2 | 3 | 4 | |
LHM 2 | .794 | |||
LTT 4 | .764 | |||
LTT 1 | .706 | |||
LTT 3 | .679 |
.591 | ||||
LHM 1 | .583 | |||
NB 3 | .757 | |||
NB 4 | .730 | |||
NB 5 | .704 | |||
NB 2 | .602 | |||
NB 1 | .526 | |||
TDTT 5 | .801 | |||
TDTT 6 | .731 | |||
TDTT 4 | .724 | |||
TDTT 1 | .688 | |||
TDTT 3 | .597 | |||
CLCN 3 | .677 | |||
CLCN 7 | .667 | |||
CLCN 6 | .619 | |||
Extraction Method: Principal Component Analysis. Rotation Method: Varimax with Kaiser Normalization. | ||||
a. Rotation converged in 6 iterations. | ||||
3.2. EFA biến phụ thuộc
Component Matrixa |
Component |
KMO and Bartlett's Test
Kaiser-Meyer-Olkin Measure of Sampling Adequacy.
.674
Bartlett's Test of Sphericity
Approx. Chi-Square
112.472
df
Sig.
3
.000
Total Variance Ex Initial Eigenvalues | plained Extraction Sums of Squared Loadings | |||||
Component | Total | % of Variance | Cumulative % | Total | % of Variance | Cumulative % |
1 | 2.022 | 67.417 | 67.417 | 2.022 | 67.417 | 67.417 |
2 | .582 | 19.387 | 86.804 | |||
3 Extraction Met | .396 hod: Princi | 13.196 pal Component | 100.000 Analysis. |
1 | |
tiep tuc gui tiet kiem tai Sacombank | .856 |
thuong hieu Sacombank rat tot | .835 |
se gioi thieu ban be, nguoi quen | .769 |
Extraction Method: Principal Component Analysis. | |
a. 1 components extracted. | |
4.Đánh giá thang đo bằng hệ số tin cậy Cronbach’s alpha sau khi rút trích
4.1. Hệ số Cronnbach’s alpha đối với biến độc lập:
Kiểm định độ tin cậy thang đo nhóm 1 Reliability Statistics
N of Items | |
.851 | 6 |
Item-Total Statistics
Scale Mean if Item Deleted | Scale Variance if Item Deleted | Corrected Item-Total Correlation | Cronbach's Alpha if Item Deleted | |
LHM 2 | 17.19 | 8.905 | .618 | .829 |
LTT 4 | 17.01 | 8.047 | .765 | .800 |
LTT 1 | 17.13 | 8.487 | .663 | .820 |
LTT 3 | 17.64 | 8.527 | .621 | .829 |
LHM 4 | 17.15 | 8.668 | .588 | .835 |
LHM 1 | 17.15 | 9.205 | .559 | .839 |
Kiểm định độ tin cậy thang đo nhóm 2 Reliability Statistics
N of Items | |
.790 | 5 |
Item-Total Statistics
Scale Mean if Item Deleted | Scale Variance if Item Deleted | Corrected Item-Total Correlation | Cronbach's Alpha if Item Deleted | |
NB 3 | 12.23 | 11.317 | .636 | .728 |
NB 4 | 12.56 | 12.651 | .552 | .758 |
NB 2 | 12.44 | 11.429 | .630 | .730 |
NB 5 | 12.32 | 12.058 | .557 | .754 |
NB 1 | 12.24 | 11.204 | .497 | .782 |
Kiểm định độ tin cậy thang đo nhóm 3 Reliability Statistics
N of Items | |
.812 | 5 |
Item-Total Statistics
Scale Mean if Item Deleted | Scale Variance if Item Deleted | Corrected Item-Total Correlation | Cronbach's Alpha if Item Deleted | |
TDTT 5 | 11.83 | 11.742 | .733 | .740 |
TDTT 6 | 12.31 | 10.201 | .666 | .757 |
TDTT 4 | 12.06 | 11.574 | .664 | .756 |
TDTT 1 | 12.06 | 12.835 | .482 | .808 |
TDTT 3 | 11.99 | 12.845 | .490 | .806 |
Kiểm định độ tin cậy thang đo nhóm 4 Reliability Statistics
N of Items | |
.729 | 3 |
Item-Total Statistics
Scale Mean if Item Deleted | Scale Variance if Item Deleted | Corrected Item-Total Correlation | Cronbach's Alpha if Item Deleted | |
CLCN 3 | 7.77 | 2.311 | .477 | .727 |
CLCN 7 | 7.74 | 2.167 | .605 | .576 |
CLCN 6 | 7.74 | 2.261 | .577 | .612 |
4.2. Hệ số Cronbach’s alpha đối với biến phụ thuộc
Reliability Statistics
N of Items | |
.757 | 3 |
Item-Total Statistics
Scale Mean if Item Deleted | Scale Variance if Item Deleted | Corrected Item- Total Correlation | Cronbach's Alpha if Item Deleted | |
thuong hieu Sacombank rat tot | 7.58 | 1.252 | .605 | .654 |
tiep tuc gui tiet kiem tai Sacombank | 7.63 | 1.215 | .640 | .614 |
se gioi thieu ban be, nguoi quen | 7.57 | 1.361 | .519 | .750 |
5. Kiểm định tính phân phối chuẩn của số liệu
One-Sample Kolmogorov-Smirnov Test
X1 | X2 | X3 | X4 | ||
N | 150 | 150 | 150 | 150 | |
Normal Parametersa | Mean | .0000000 | .0000000 | -2.2204460E-17 | -1.6135241E-16 |
Std. Deviation | 1.00000000E0 | 1.00000000 | 1.00000000E0 | 1.00000000E0 | |
Most Extreme Differences | Absolute | .072 | .048 | .054 | .095 |
Positive | .034 | .048 | .054 | .065 | |
Negative | -.072 | -.046 | -.052 | -.095 | |
Kolmogorov-Smirnov Z | .879 | .592 | .659 | 1.164 | |
Asymp. Sig. (2-tailed) | .423 | .875 | .778 | .133 | |
Exact Sig. (2-tailed) | .404 | .858 | .758 | .125 | |
Point Probability | .000 | .000 | .000 | .000 | |
a. Test distribution is Normal. | |||||