N of Items | |
.612 | 4 |
Có thể bạn quan tâm!
-
 Dàn Bài Thảo Luận Tay Đôi Với Các Chuyên Gia Trong Nghiên Cứu Định Tính (Sơ Bộ)
 -
 Hoàn Toàn Không Đồng Ý; 2: Không Đồng Ý; 3: Trung Hòa; 4: Đồng Ý; 5: Hoàn Toàn Đồng Ý
 -
 Kết Quả Kiểm Định Cronbach’S Alpha Của Các Nhân Tố
 -
 Các nhân tố tác động đến sự hài lòng của khách hàng khi sử dụng dịch vụ chuyển tiền bằng điện T-T thanh toán hàng hoá nhập khẩu tại Ngân hàng thương mại cổ phần Sài gòn Thương tín Sacombank - 18
Xem toàn bộ 145 trang tài liệu này.

Item-Total Statistics
Scale Mean if Item Deleted | Scale Variance if Item Deleted | Corrected Item- Total Correlation | Cronbach's Alpha if Item Deleted | |
DC1 | 8.5435 | 3.708 | .539 | .460 |
DC2 | 8.5217 | 3.037 | .649 | .338 |
DC3 | 7.6739 | 3.243 | .432 | .511 |
DC4 | 8.2478 | 4.449 | .079 | .772 |
Thang đo nhân tố chất lượng dịch vụ
Reliability Statistics
N of Items | |
.830 | 3 |
Item-Total Statistics
Scale Mean if Item Deleted | Scale Variance if Item Deleted | Corrected Item- Total Correlation | Cronbach's Alpha if Item Deleted | |
CL1 | 6.3217 | 3.922 | .625 | .833 |
CL2 | 6.2478 | 4.187 | .662 | .792 |
CL3 | 6.1174 | 3.650 | .790 | .663 |
N of Items | |
.792 | 3 |
Item-Total Statistics
Scale Mean if Item Deleted | Scale Variance if Item Deleted | Corrected Item- Total Correlation | Cronbach's Alpha if Item Deleted | |
CP1 | 6.3391 | 4.077 | .627 | .726 |
CP2 | 6.1348 | 3.986 | .647 | .704 |
CP3 | 6.5522 | 4.196 | .629 | .724 |
Thang đo nhân tố sự hài lòng của khách hàng khi sử dụng dịch vụ
Reliability Statistics
N of Items | |
.851 | 4 |
Item-Total Statistics
Scale Mean if Item Deleted | Scale Variance if Item Deleted | Corrected Item- Total Correlation | Cronbach's Alpha if Item Deleted | |
HL1 | 10.7000 | 5.879 | .748 | .789 |
HL2 | 10.9174 | 5.412 | .745 | .786 |
HL3 | 10.8261 | 5.393 | .691 | .814 |
HL4 | 11.3435 | 6.515 | .596 | .848 |
PHỤ LỤC 8: KIỂM ĐỊNH NHÂN TỐ KHÁM PHÁ EFA
Kết quả phân tích nhân tố khám phá EFA lần 1 cho thang đo các nhân tố tác động đến chất lượng dịch vụ
Kaiser-Meyer-Olkin Measure of Sampling Adequacy. | .846 | |
Bartlett's Test of Sphericity | Approx. Chi-Square | 2.287E3 |
df | 210 | |
Sig. | .000 | |
Total Variance Explained
Initial Eigenvalues | Extraction Sums of Squared Loadings | Rotation Sums of Squared Loadings | |||||||
Total | % of Variance | Cumulative % | Total | % of Variance | Cumulative % | Total | % of Variance | Cumulative % | |
1 | 6.724 | 32.018 | 32.018 | 6.724 | 32.018 | 32.018 | 3.199 | 15.231 | 15.231 |
2 | 2.186 | 10.411 | 42.429 | 2.186 | 10.411 | 42.429 | 3.091 | 14.717 | 29.949 |
3 | 2.021 | 9.622 | 52.052 | 2.021 | 9.622 | 52.052 | 2.783 | 13.253 | 43.202 |
4 | 1.693 | 8.061 | 60.113 | 1.693 | 8.061 | 60.113 | 2.438 | 11.608 | 54.810 |
5 | 1.055 | 5.025 | 65.138 | 1.055 | 5.025 | 65.138 | 2.169 | 10.327 | 65.138 |
6 | .878 | 4.181 | 69.319 | ||||||
7 | .790 | 3.760 | 73.079 | ||||||
8 | .688 | 3.278 | 76.357 | ||||||
9 | .627 | 2.985 | 79.342 | ||||||
10 | .584 | 2.779 | 82.121 | ||||||
11 | .547 | 2.604 | 84.725 | ||||||
12 | .456 | 2.172 | 86.897 | ||||||
13 | .421 | 2.005 | 88.902 | ||||||
14 | .408 | 1.945 | 90.847 | ||||||
15 | .373 | 1.776 | 92.624 | ||||||
16 | .344 | 1.640 | 94.263 | ||||||
17 | .333 | 1.584 | 95.847 | ||||||
18 | .289 | 1.374 | 97.222 | ||||||
19 | .264 | 1.255 | 98.477 | ||||||
20 | .185 | .881 | 99.358 | ||||||
21 | .135 | .642 | 100.000 |
Extraction Method: Principal Component Analysis.
Rotated Component Matrixa
Component | |||||
1 | 2 | 3 | 4 | 5 | |
DB4 | .757 | ||||
DB3 | .729 | ||||
DB2 | .729 | ||||
DB5 | .671 | ||||
DB1 | .636 | ||||
HH2 | .882 | ||||
HH4 | .862 | ||||
HH1 | .787 | ||||
HH3 | .682 | ||||
TC3 | .846 | ||||
TC2 | .737 | ||||
TC4 | .719 | ||||
TC1 | .579 | ||||
DU1 | .425 | .508 | |||
DU4 | .302 | .767 | |||
DU3 | .710 | ||||
DU2 | .677 | ||||
DU5 | .357 | .644 | |||
DC2 | .872 | ||||
DC1 | .828 | ||||
DC3 | .787 |
Kết quả phân tích nhân tố khám phá EFA lần 2 cho thang đo các nhân tố tác động đến chất lượng dịch vụ
Kaiser-Meyer-Olkin Measure of Sampling Adequacy. | .836 | |
Bartlett's Test of Sphericity | Approx. Chi-Square | 2.151E3 |
df | 190 | |
Sig. | .000 | |
Total Variance Explained
Initial Eigenvalues | Extraction Sums of Squared Loadings | Rotation Sums of Squared Loadings | |||||||
Total | % of Variance | Cumulative % | Total | % of Variance | Cumulative % | Total | % of Variance | Cumulative % | |
1 | 6.334 | 31.672 | 31.672 | 6.334 | 31.672 | 31.672 | 3.080 | 15.399 | 15.399 |
2 | 2.183 | 10.914 | 42.586 | 2.183 | 10.914 | 42.586 | 3.005 | 15.026 | 30.425 |
3 | 2.016 | 10.082 | 52.669 | 2.016 | 10.082 | 52.669 | 2.527 | 12.634 | 43.058 |
4 | 1.680 | 8.400 | 61.069 | 1.680 | 8.400 | 61.069 | 2.468 | 12.342 | 55.400 |
5 | 1.034 | 5.170 | 66.239 | 1.034 | 5.170 | 66.239 | 2.168 | 10.839 | 66.239 |
6 | .878 | 4.390 | 70.629 | ||||||
7 | .717 | 3.584 | 74.213 | ||||||
8 | .650 | 3.249 | 77.462 | ||||||
9 | .618 | 3.092 | 80.555 | ||||||
10 | .561 | 2.807 | 83.362 | ||||||
11 | .489 | 2.446 | 85.808 | ||||||
12 | .443 | 2.217 | 88.024 | ||||||
13 | .421 | 2.105 | 90.130 | ||||||
14 | .383 | 1.916 | 92.046 | ||||||
15 | .356 | 1.779 | 93.825 | ||||||
16 | .342 | 1.710 | 95.535 | ||||||
17 | .303 | 1.515 | 97.050 | ||||||
18 | .265 | 1.323 | 98.373 | ||||||
19 | .189 | .946 | 99.319 | ||||||
20 | .136 | .681 | 100.000 |
Extraction Method: Principal Component Analysis.
Rotated Component Matrixa
Component | |||||
1 | 2 | 3 | 4 | 5 | |
HH2 | .885 | ||||
HH4 | .865 | ||||
HH1 | .794 | ||||
HH3 | .685 | ||||
DB4 | .762 | ||||
DB3 | .730 | ||||
DB2 | .727 | ||||
DB5 | .691 | ||||
DB1 | .624 | .305 | |||
TC3 | .838 | ||||
TC4 | .747 | ||||
TC2 | .735 | ||||
TC1 | .581 | ||||
DU4 | .791 | ||||
DU3 | .313 | .737 | |||
DU2 | .680 | ||||
DU5 | .354 | .607 | |||
DC2 | .871 | ||||
DC1 | .833 | ||||
DC3 | .781 |
Kết quả phân tích nhân tố khám phá EFA cho thang đo các nhân tố tác động đến sự hài lòng khi sử dụng dịch vụ
Kaiser-Meyer-Olkin Measure of Sampling Adequacy. | .795 | |
Bartlett's Test of Sphericity | Approx. Chi-Square | 584.915 |
df | 15 | |
Sig. | .000 | |
Total Variance Explained
Initial Eigenvalues | Extraction Sums of Squared Loadings | Rotation Sums of Squared Loadings | |||||||
Total | % of Variance | Cumulative % | Total | % of Variance | Cumulative % | Total | % of Variance | Cumulative % | |
1 | 3.385 | 56.425 | 56.425 | 3.385 | 56.425 | 56.425 | 2.259 | 37.644 | 37.644 |
2 | 1.002 | 16.700 | 73.125 | 1.002 | 16.700 | 73.125 | 2.129 | 35.480 | 73.125 |
3 | .535 | 8.911 | 82.036 | ||||||
4 | .429 | 7.150 | 89.186 | ||||||
5 | .416 | 6.940 | 96.127 | ||||||
6 | .232 | 3.873 | 100.000 |
Extraction Method: Principal Component Analysis.
Rotated Component Matrixa
Component | ||
1 | 2 | |
CL3 | .907 | |
CL2 | .818 | |
CL1 | .759 | .305 |
CP3 | .837 | |
CP2 | .810 | |
CP1 | .316 | .763 |
Kết quả phân tích nhân tố khám phá EFA cho thang đo chất lượng dịch vụ TTQT
Kaiser-Meyer-Olkin Measure of Sampling Adequacy. | .665 | |
Bartlett's Test of Sphericity | Approx. Chi-Square | 291.059 |
df | 3 | |
Sig. | .000 | |
Total Variance Explained
Initial Eigenvalues | Extraction Sums of Squared Loadings | |||||
Total | % of Variance | Cumulative % | Total | % of Variance | Cumulative % | |
1 | 2.250 | 75.015 | 75.015 | 2.250 | 75.015 | 75.015 |
2 | .505 | 16.847 | 91.862 | |||
3 | .244 | 8.138 | 100.000 |
Extraction Method: Principal Component Analysis.
Component Matrixa
Component | |
1 | |
CL3 | .920 |
CL2 | .853 |
CL1 | .823 |
Kết quả phân tích nhân tố khám phá EFA cho thang đo sự hài lòng của khách hàng khi sử dụng dịch vụ TTQT
KMO and Bartlett's Test
.752 | ||
Bartlett's Test of Sphericity | Approx. Chi-Square | 426.072 |
df | 6 | |
Sig. | .000 |
Total Variance Explained
Initial Eigenvalues | Extraction Sums of Squared Loadings | |||||
Total | % of Variance | Cumulative % | Total | % of Variance | Cumulative % | |
1 | 2.779 | 69.468 | 69.468 | 2.779 | 69.468 | 69.468 |
2 | .572 | 14.299 | 83.767 | |||
3 | .421 | 10.520 | 94.286 | |||
4 | .229 | 5.714 | 100.000 |
Extraction Method: Principal Component Analysis.
Component Matrixa
Component | |
1 | |
HL2 | .872 |
HL1 | .868 |
HL3 | .833 |
HL4 | .755 |
PHỤ LỤC 9: KẾT QUẢ PHÂN TÍCH HỒI QUY
Kết quả phân tích hồi quy các nhân tố ảnh hưởng đến chất lượng dịch vụ TTQT
Variables Entered/Removedb
Variables Entered | Variables Removed | Method | |
1 | DC, HH, TC, DU, DBa | . | Enter |
a. All requested variables entered.
b. Dependent Variable: CL
Model Summary
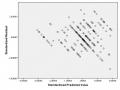
R | R Square | Adjusted R Square | Std. Error of the Estimate | |
1 | .848a | .719 | .713 | .50946 |
a. Predictors: (Constant), DC, HH, TC, DU, DB
ANOVAb
Sum of Squares | df | Mean Square | F | Sig. | Durbin- Watson | ||
1 | Regression | 148.734 | 5 | 29.747 | 114.607 | .000a | 0.2119 |
Residual | 58.140 | 224 | .260 | ||||
Total | 206.874 | 229 |
a. Predictors: (Constant), DC, HH, TC, DU, DB
b. Dependent Variable: CL
Model | Unstandardized Coefficients | Standardized Coefficients | t | Sig. | |||
B | Std. Error | Beta | |||||
1 | (Constant) | -.538 | .166 | -3.239 | .001 | ||
HH | .193 | .042 | .189 | 4.543 | .000 | ||
TC | .488 | .045 | .465 | 10.769 | .000 | ||
DU | .158 | .053 | .136 | 3.003 | .003 | ||
DB | .161 | .056 | .143 | 2.856 | .005 | ||
DC | .196 | .051 | .175 | 3.876 | .000 | ||
a. Dependent Variable: CL | |||||||
Kết quả phân tích hồi quy các nhân tố ảnh hưởng đến sự hài lòng khi sử dụng dịch vụ TTQT
Descriptive Statistics
Mean | Std. Deviation | N | |
HL | 3.6489 | .78353 | 230 |
CL | 3.1145 | .95046 | 230 |
CP | 3.3043 | .87455 | 230 |
Variables Entered/Removedb
Variables Entered | Variables Removed | Method | |
1 | CP, CLa | . | Enter |
a. All requested variables entered.