Rotated Component Matrixa
Component | |||||||
1 | 2 | 3 | 4 | 5 | 6 | 7 | |
PU4 | .832 | ||||||
PU1 | .796 | ||||||
PU5 | .788 | ||||||
PU3 | .763 | ||||||
PU2 | .743 | ||||||
PR3 | .876 | ||||||
PR2 | .850 | ||||||
PR1 | .818 | ||||||
PR4 | .816 | ||||||
PE4 | .835 | ||||||
PE1 | .820 | ||||||
PE2 | .810 | ||||||
PE3 | .770 | ||||||
BI2 | .829 | ||||||
BI3 | .828 | ||||||
BI4 | .742 | ||||||
BI1 | .719 | ||||||
SI2 | .852 | ||||||
SI1 | .837 | ||||||
SI3 | .819 | ||||||
PT2 | .859 | ||||||
PT1 | .813 | ||||||
PT3 | .803 | ||||||
AT4 | .841 | ||||||
AT2 | .829 | ||||||
AT3 | .737 |
Có thể bạn quan tâm!
-

 Tận Dụng Các Tác Động Của Ảnh Hưởng Xã Hội
 -
 Các nhân tố tác động đến quyết định sử dụng dịch vụ ngân hàng điện tử của khách hàng cá nhân tại thành phố Hà Nội - 15
 -
 Các nhân tố tác động đến quyết định sử dụng dịch vụ ngân hàng điện tử của khách hàng cá nhân tại thành phố Hà Nội - 16
 -
 Các nhân tố tác động đến quyết định sử dụng dịch vụ ngân hàng điện tử của khách hàng cá nhân tại thành phố Hà Nội - 18
Xem toàn bộ 149 trang tài liệu này.
Extraction Method: Principal Component Analysis. Rotation Method: Varimax with Kaiser Normalization.
a. Rotation converged in 6 iterations.
Phân tích nhân tố biến phụ thuộc
Kaiser-Meyer-Olkin Measure of Sampling Adequacy. | .708 | |
Bartlett's Test of Sphericity | Approx. Chi-Square | 355.303 |
df | 3 | |
Sig. | .000 | |
Component | Initial Eigenvalues | Extraction Sums of Squared Loadings | ||||
Total | % of Variance | Cumulative % | Total | % of Variance | Cumulative % | |
1 | 2.180 | 72.667 | 72.667 | 2.180 | 72.667 | 72.667 |
2 | .467 | 15.567 | 88.234 | |||
3 | .353 | 11.766 | 100.000 | |||
Extraction Method: Principal Component Analysis. | ||||||
Component | |
1 | |
DU3 | .870 |
DU1 | .863 |
DU2 | .824 |
Extraction Method: | |
a. 1 components | |
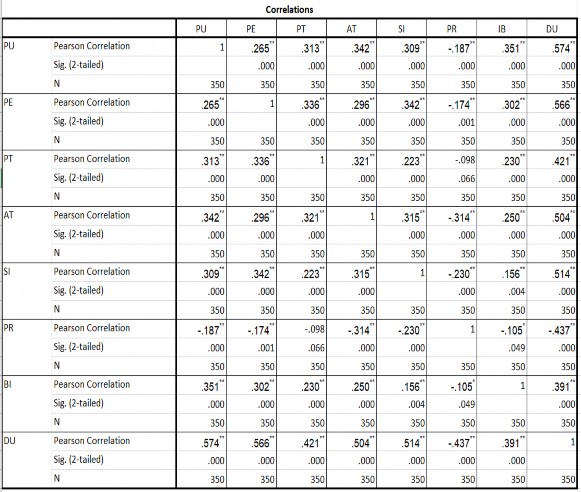
4. PHÂN TÍCH TƯƠNG QUAN
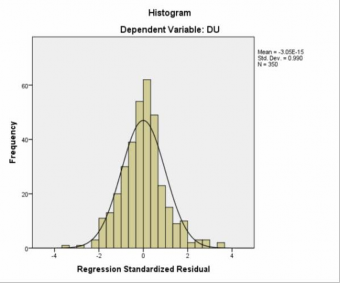
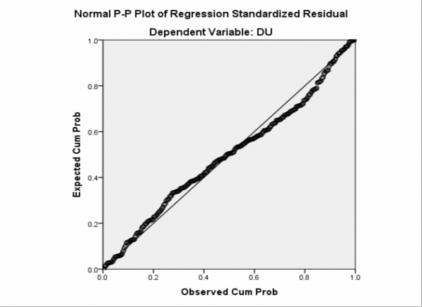
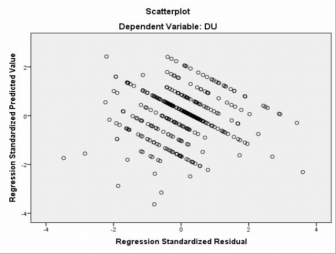
5. PHÂN TÍCH HỒI QUY
Model Summaryb
R | R Square | Adjusted R Square | Std. Error of the Estimate | Durbin-Watson | |
1 | .819a | .671 | .664 | .37273 | 1.930 |
a. Predictors: (Constant), BI, PR, PT, SI, PE, PU, AT
b. Dependent Variable: DU
ANOVAa
Sum of Squares | df | Mean Square | F | Sig. | ||
1 | Regression | 96.842 | 7 | 13.835 | 99.582 | .000b |
Residual | 47.513 | 342 | .139 | |||
Total | 144.354 | 349 |
a. Dependent Variable: DU
b. Predictors: (Constant), BI, PR, PT, SI, PE, PU, AT
Coefficientsa
Unstandardized Coefficients | Standardized Coefficients | t | Sig. | Collinearity Statistics | ||||
B | Std. Error | Beta | Tolerance | VIF | ||||
1 | (Constant) | .410 | .230 | .284 | 1.784 | .075 | .746 | 1.341 |
PU | .290 | .037 | 7.906 | .000 | ||||
PE | .285 | .036 | .279 | 7.839 | .000 | .758 | 1.319 | |
PT | .101 | .033 | .107 | 3.077 | .002 | .798 | 1.253 | |
AT | .135 | .037 | .132 | 3.651 | .000 | .735 | 1.360 | |
SI | .134 | .024 | .198 | 5.691 | .000 | .791 | 1.264 | |
PR | -.151 | .022 | -.227 | -6.857 | .000 | .876 | 1.142 | |
BI | .109 | .039 | .095 | 2.758 | .006 | .817 | 1.223 |
a. Dependent Variable: DU
6. KIỂM ĐỊNH INDEPENDENT SAMPLES TEST THEO GIỚI TÍNH
gioitinh | N | Mean | Std. Deviation | Std. Error Mean | ||||||
DU | Nam | 145 | 3.8276 | .65629 | .05450 | |||||
Nữ | 205 | 3.9138 | .63284 | .04420 | ||||||
Independent Samples Test | ||||||||||
Equality of Variances | t-test for Equality of Means | |||||||||
F | Sig. | t | df | Sig. (2- tailed) | Mean Difference | Std. Error Difference | of the Difference | |||
Lower | Upper | |||||||||
DU | Equal variances assumed | .620 | .432 | -1.237 | 348 | .217 | -.08623 | .06973 | -.22339 | .05092 |
Equal variances not assumed | -1.229 | 303.141 | .220 | -.08623 | .07017 | -.22432 | .05185 | |||
7. KIỂM ĐỊNH ANOVA
Theo độ tuổi:
Descriptives | ||||||||
N | Mean | Std. Deviation | Std. Error | for Mean | Minimum | Maximum | ||
Lower Bound | Upper Bound | |||||||
Từ 18 - 30 tuổi | 142 | 3.9413 | .57571 | .04831 | 3.8458 | 4.0368 | 3.00 | 5.00 |
Từ 31 – 40 tuổi | 119 | 3.8992 | .65750 | .06027 | 3.7798 | 4.0185 | 1.67 | 5.00 |
Từ 41 - 50 tuổi | 62 | 3.8387 | .75081 | .09535 | 3.6480 | 4.0294 | 1.67 | 5.00 |
Trên 50 tuổi | 27 | 3.5432 | .57101 | .10989 | 3.3173 | 3.7691 | 2.67 | 4.33 |
Total | 350 | 3.8781 | .64313 | .03438 | 3.8105 | 3.9457 | 1.67 | 5.00 |
DU | |||
Levene Statistic | df1 | df2 | Sig. |
2.259 | 3 | 346 | .081 |
ANOVA | |||||
Sum of Squares | df | Mean Square | F | Sig. | |
Between Groups | 3.745 | 3 | 1.248 | 3.071 | .028 |
Within Groups | 140.610 | 346 | .406 | ||
Total | 144.354 | 349 |
Dependent Variable: DU LSD | Multiple Comparisons | |||||
(I) tuoi | Mean Difference (I-J) | Std. Error | Sig. | 95% Confidence Interval | ||
Lower Bound | Upper Bound | |||||
Từ 18 - 30 tuổi | Từ 31 – 40 tuổi | .04215 | .07923 | .595 | -.1137 | .1980 |
Từ 41 - 50 tuổi | .10260 | .09704 | .291 | -.0883 | .2935 | |
Trên 50 tuổi | .39810* | .13384 | .003 | .1349 | .6613 | |
Từ 31 – 40 tuổi | Từ 18 - 30 tuổi | -.04215 | .07923 | .595 | -.1980 | .1137 |
Từ 41 - 50 tuổi | .06045 | .09985 | .545 | -.1359 | .2568 | |
Trên 50 tuổi | .35595* | .13589 | .009 | .0887 | .6232 | |
Từ 41 - 50 tuổi | Từ 18 - 30 tuổi | -.10260 | .09704 | .291 | -.2935 | .0883 |
Từ 31 – 40 tuổi | -.06045 | .09985 | .545 | -.2568 | .1359 | |
Trên 50 tuổi | .29550* | .14699 | .045 | .0064 | .5846 | |
Trên 50 tuổi | Từ 18 - 30 tuổi | -.39810* | .13384 | .003 | -.6613 | -.1349 |
Từ 31 – 40 tuổi | -.35595* | .13589 | .009 | -.6232 | -.0887 | |
Từ 41 - 50 tuổi | -.29550* | .14699 | .045 | -.5846 | -.0064 | |
*. The mean difference is significant at the 0.05 level. | ||||||
Theo học vấn:
Descriptives | ||||||||
N | Mean | Std. Deviation | Std. Error | for Mean | Minimum | Maximum | ||
Lower Bound | Upper Bound | |||||||
Phổ thông | 34 | 3.8431 | .52695 | .09037 | 3.6593 | 4.0270 | 3.00 | 5.00 |
Cao đẳng | 91 | 3.8462 | .58649 | .06148 | 3.7240 | 3.9683 | 2.33 | 5.00 |
Đại học | 187 | 3.8859 | .68701 | .05024 | 3.7868 | 3.9850 | 1.67 | 5.00 |
Sau đại học | 38 | 3.9474 | .66000 | .10707 | 3.7304 | 4.1643 | 2.67 | 5.00 |
Total | 350 | 3.8781 | .64313 | .03438 | 3.8105 | 3.9457 | 1.67 | 5.00 |
Test of Homogeneity of Variances | ||||||||
DU | ||||||||
Levene Statistic | df1 | df2 | Sig. | |||||
.545 | 3 | 346 | .652 | |||||
ANOVA | ||||||||
DU | ||||||||
Sum of Squares | df | Mean Square | F | Sig. | ||||
Between Groups | .328 | 3 | .109 | .263 | .852 | |||
Within Groups | 144.026 | 346 | .416 | |||||
Total | 144.354 | 349 | ||||||
Theo nghề nghiệp:
Descriptives | ||||||||
N | Mean | Std. Deviation | Std. Error | for Mean | Minimum | Maximum | ||
Lower Bound | Upper Bound | |||||||
Học sinh/ sinh viên | 25 | 3.8133 | .50074 | .10015 | 3.6066 | 4.0200 | 3.00 | 4.67 |
Cán bộ, nhân viên văn phòng | 169 | 3.9152 | .65367 | .05028 | 3.8159 | 4.0145 | 1.67 | 5.00 |
Công nhân, lao động phổ thông | 72 | 3.8102 | .52130 | .06144 | 3.6877 | 3.9327 | 2.33 | 5.00 |
Tự doanh | 48 | 3.9236 | .75400 | .10883 | 3.7047 | 4.1425 | 1.67 | 5.00 |
Khác… | 36 | 3.8241 | .74954 | .12492 | 3.5705 | 4.0777 | 1.67 | 5.00 |
Total | 350 | 3.8781 | .64313 | .03438 | 3.8105 | 3.9457 | 1.67 | 5.00 |
Test of Homogeneity of Variances | ||||||||
DU | ||||||||
Levene Statistic | df1 | df2 | Sig. | |||||
1.370 | 4 | 345 | .244 | |||||
ANOVA | ||||||||
DU | ||||||||
Sum of Squares | df | Mean Square | F | Sig. | ||||
Between Groups | .874 | 4 | .218 | .525 | .717 | |||
Within Groups | 143.480 | 345 | .416 | |||||
Total | 144.354 | 349 | ||||||
Theo thu nhập:
Descriptives | ||||||||
N | Mean | Std. Deviation | Std. Error | for Mean | Minimum | Maximum | ||
Lower Bound | Upper Bound | |||||||
Dưới 5 triệu đồng | 39 | 3.7265 | .69194 | .11080 | 3.5022 | 3.9508 | 1.67 | 5.00 |
Từ 5 - 10 triệu đồng | 99 | 3.8418 | .60486 | .06079 | 3.7211 | 3.9624 | 1.67 | 5.00 |
Từ 10 - 15 triệu đồng | 115 | 3.8812 | .68140 | .06354 | 3.7553 | 4.0070 | 1.67 | 5.00 |
Trên 15 triệu đồng | 97 | 3.9725 | .60795 | .06173 | 3.8500 | 4.0950 | 2.67 | 5.00 |
Total | 350 | 3.8781 | .64313 | .03438 | 3.8105 | 3.9457 | 1.67 | 5.00 |
Test of Homogeneity of Variances | ||||||||
DU | ||||||||
Levene Statistic | df1 | df2 | Sig. | |||||
.908 | 3 | 346 | .437 | |||||
ANOVA | ||||||||
DU | ||||||||
Sum of Squares | df | Mean Square | F | Sig. | ||||
Between Groups | 1.893 | 3 | .631 | 1.532 | .206 | |||
Within Groups | 142.461 | 346 | .412 | |||||
Total | 144.354 | 349 | ||||||