Total Variance Explained
Initial Eigenvalues | Extraction Sums of Squared Loadings | |||||
Total | % of Variance | Cumulative % | Total | % of Variance | Cumulative % | |
1 | 2.201 | 55.035 | 55.035 | 2.201 | 55.035 | 55.035 |
2 | .722 | 18.047 | 73.081 | |||
3 | .616 | 15.399 | 88.480 | |||
4 | .461 | 11.520 | 100.000 |
Có thể bạn quan tâm!
-

 Ảnh hưởng của yếu tố hình ảnh điểm đến tới sự hài lòng của khách du lịch nội địa tại thành phố Đà Nẵng - 13
 -
 Ảnh hưởng của yếu tố hình ảnh điểm đến tới sự hài lòng của khách du lịch nội địa tại thành phố Đà Nẵng - 14
 -
 Ảnh hưởng của yếu tố hình ảnh điểm đến tới sự hài lòng của khách du lịch nội địa tại thành phố Đà Nẵng - 15
Xem toàn bộ 137 trang tài liệu này.
Component Matrixa
Component | |
1 | |
HL1 | .723 |
HL2 | .719 |
HL3 | .730 |
HL4 | .793 |
V. PHÂN TÍCH HỒI QUY TUYẾN TÍNH
Bảng 3.16 Kết quả phân tích hồi quy tuyến tính
Model Summaryb
R | R Square | Adjusted R Square | Std. Error of the Estimate | Durbin-Watson | |
1 | .744a | .553 | .543 | .33080 | 1.834 |
a. Predictors: (Constant), BKK, TNG, HT, CQ, TNH, CN
b. Dependent Variable: HL
ANOVAb
Sum of Squares | df | Mean Square | F | Sig. | ||
1 | Regression | 33.749 | 6 | 5.625 | 51.403 | .000a |
Residual | 27.247 | 249 | .109 | |||
Total | 60.996 | 255 |
Model Summaryb
R | R Square | Adjusted R Square | Std. Error of the Estimate | Durbin-Watson | |
1 | .744a | .553 | .543 | .33080 | 1.834 |
a. Predictors: (Constant), BKK, TNG, HT, CQ, TNH, CN
b. Dependent Variable: HL
Coefficientsa
Unstandardized Coefficients | Standardized Coefficients | t | Sig. | Collinearity | Statistics | |||
B | Std. Error | Beta | Tolerance | VIF | ||||
1 | (Constant) | .079 | .121 | .657 | .512 | |||
TNH | .207 | .049 | .233 | 4.214 | .000 | .586 | 1.707 | |
TNG | .088 | .044 | .104 | 2.019 | .045 | .682 | 1.466 | |
HT | .129 | .049 | .127 | 2.634 | .009 | .769 | 1.301 | |
CN | .100 | .047 | .122 | 2.117 | .035 | .544 | 1.838 | |
CQ | .179 | .054 | .178 | 3.297 | .001 | .613 | 1.632 | |
BKK | .232 | .045 | .263 | 5.196 | .000 | .698 | 1.433 |
a. Dependent Variable: HL
VI. KIỂM ĐỊNH CÁC GIẢ ĐỊNH CỦA MÔ HÌNH HỒI QUY
Bảng 3.17 Ma trận hệ số tương quan
HL | TNH | TNG | HT | CN | CQ | BKK | ||
HL | Pearson Correlation | 1 | .592** | .475** | .436** | .550** | .531** | .566** |
Sig. (2-tailed) | .000 | .000 | .000 | .000 | .000 | .000 | ||
N | 256 | 256 | 256 | 256 | 256 | 256 | 256 | |
TNH | Pearson Correlation | 1 | .478** | .428** | .498** | .459** | .427** |
Sig. (2-tailed) | .000 | .000 | .000 | .000 | .000 | |||
N | 256 | 256 | 256 | 256 | 256 | 256 | ||
TNG | Pearson Correlation | 1 | .346** | .439** | .420** | .332** | ||
Sig. (2-tailed) | .000 | .000 | .000 | .000 | ||||
N | 256 | 256 | 256 | 256 | 256 | |||
HT | Pearson Correlation | 1 | .302** | .264** | .337** | |||
Sig. (2-tailed) | .000 | .000 | .000 | |||||
N | 256 | 256 | 256 | 256 | ||||
CN | Pearson Correlation | 1 | .572** | .480** | ||||
Sig. (2-tailed) | .000 | .000 | ||||||
N | 256 | 256 | 256 | |||||
CQ | Pearson Correlation | 1 | .377** | |||||
Sig. (2-tailed) | .000 | |||||||
N | 256 | 256 | ||||||
BKK | Pearson Correlation | 1 | ||||||
Sig. (2-tailed) | ||||||||
N | 256 | |||||||
**. Correlation is significant at the 0.01 level (2-tailed). | ||||||||
Bảng 3.18 Kết quả kiểm định Durbin – Watson
Model Summaryb
R | R Square | Adjusted R Square | Std. Error of the Estimate | Durbin-Watson | |
1 | .744a | .553 | .543 | .33080 | 1.834 |
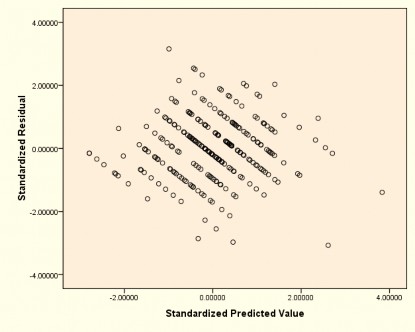
Hình 3.1. Đồ thị Scatterplot
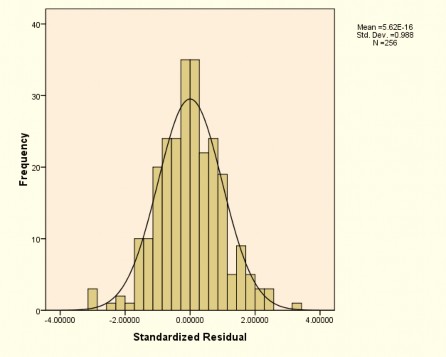
Hình 3.2. Đồ thị tần số Histogram
Bảng 3.19 Kết quả kiểm định Spesrman
Spearman’s rho | TNH | TNG | HT | CN | CQ | BKK | ABS | |
ABS | Pearson Correlation | -.031 | -.007 | .058 | .008 | -.002 | .071 | 1.000 |
Sig. (2-tailed) | .620 | .912 | .358 | .898 | .969 | .261 | . | |
N | 256 | 256 | 256 | 256 | 256 | 256 | 256 | |
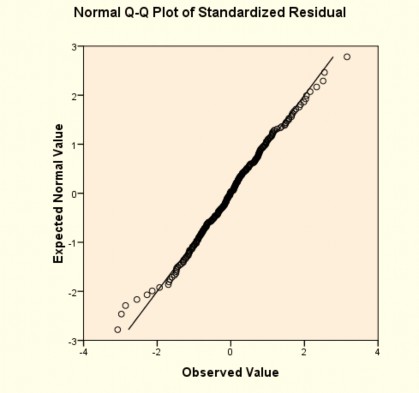
Hình 3.3. Đồ thị tần số Q-Q Plot