16
Bảng 1.2. Tổng hợp hệ số tin cậy Cronbach’s Alpha của các thang đo
Thang đo | Số lượng chỉ báo | Hệ số Cronbach’s Alpha | |
1 | Lãnh đạo ngân hàng | 3 | 0,891 |
2 | Nhân viên ngân hàng | 3 | 0,866 |
3 | Đặc trưng công việc | 5 | 0,807 |
4 | Môi trường cạnh tranh | 3 | 0,854 |
5 | Khách hàng | 3 | 0,830 |
6 | Quá trình hội nhập | 3 | 0,769 |
7 | 7 | 0,671 | |
Tổng | 28 | ||
Có thể bạn quan tâm!
-

 Văn hóa doanh nghiệp tại các ngân hàng thương mại ở tỉnh Quảng Ngãi - 25
 -
 Tổng Hợp Hệ Số Tin Cậy Cronbach’S Alpha Của Các Thang Đo
 -
 Kiểm Tra Độ Tin Cậy – Cronbach’S Alpha
 -
 Văn hóa doanh nghiệp tại các ngân hàng thương mại ở tỉnh Quảng Ngãi - 29
Xem toàn bộ 238 trang tài liệu này.
2. PHÂN TÍCH NHÂN TỐ - EFA
Kaiser-Meyer-Olkin Measure of Sampling Adequacy. | .689 | |
Bartlett's Test of Sphericity | Approx. Chi-Square | 2019.037 |
df | 190 | |
Sig. | .000 | |
2.2. Total Variance Explained
Initial Eigenvalues | Extraction Sums of Squared Loadings | Rotation Sums of Squared Loadings | |||||||
Total | % of Variance | Cumulative % | Total | % of Variance | Cumulative % | Total | % of Variance | Cumulative % | |
1 | 4.237 | 21.186 | 21.186 | 4.237 | 21.186 | 21.186 | 2.957 | 14.783 | 14.783 |
2 | 2.688 | 13.442 | 34.629 | 2.688 | 13.442 | 34.629 | 2.663 | 13.313 | 28.096 |
3 | 2.352 | 11.760 | 46.388 | 2.352 | 11.760 | 46.388 | 2.497 | 12.483 | 40.579 |
4 | 2.121 | 10.606 | 56.995 | 2.121 | 10.606 | 56.995 | 2.360 | 11.801 | 52.379 |
5 | 2.002 | 10.010 | 67.005 | 2.002 | 10.010 | 67.005 | 2.310 | 11.549 | 63.928 |
6 | 1.472 | 7.361 | 74.367 | 1.472 | 7.361 | 74.367 | 2.088 | 10.438 | 74.367 |
7 | .817 | 4.085 | 78.452 | ||||||
8 | .758 | 3.790 | 82.241 | ||||||
9 | .690 | 3.450 | 85.691 | ||||||
10 | .559 | 2.793 | 88.484 | ||||||
11 | .502 | 2.512 | 90.996 |
.395 | 1.974 | 92.970 | |
13 | .330 | 1.648 | 94.618 |
14 | .257 | 1.286 | 95.904 |
15 | .243 | 1.214 | 97.119 |
16 | .189 | .946 | 98.065 |
17 | .141 | .704 | 98.769 |
18 | .124 | .620 | 99.388 |
19 | .102 | .508 | 99.896 |
20 | .021 | .104 | 100.000 |
12
Extraction Method: Principal Component Analysis.
2.3. Rotated Component Matrixa
Component | ||||||
1 | 2 | 3 | 4 | 5 | 6 | |
CV1 | .896 | |||||
CV5 | .888 | |||||
CV4 | .691 | |||||
CV2 | .682 | |||||
CV3 | .567 | |||||
NV1 | .917 | |||||
NV3 | .912 | |||||
NV2 | .700 | |||||
LD3 | .935 | |||||
LD1 | .913 | |||||
LD2 | .834 | |||||
CT2 | .901 | |||||
CT1 | .870 | |||||
CT3 | .848 | |||||
KH2 | .925 | |||||
KH4 | .913 | |||||
KH1 | .747 | |||||
HN3 | .866 | |||||
HN4 | .792 | |||||
HN2 | .752 |
Extraction Method: Principal Component Analysis. Rotation Method: Varimax with Kaiser Normalization.
a. Rotation converged in 5 iterations.
3. CRONBACH’S ALPHA SAU EFA
Reliability Statistics
N of Items | |
.866 | 3 |
Item-Total Statistics
Scale Mean if Item Deleted | Scale Variance if Item Deleted | Corrected Item- Total Correlation | Cronbach's Alpha if Item Deleted | |
NV1 | 8.68 | 2.232 | .866 | .694 |
NV2 | 8.70 | 2.896 | .537 | .989 |
NV3 | 8.70 | 2.251 | .861 | .699 |
Reliability Statistics
N of Items | |
.854 | 3 |
Item-Total Statistics
Scale Mean if Item Deleted | Scale Variance if Item Deleted | Corrected Item- Total Correlation | Cronbach's Alpha if Item Deleted | |
CT1 | 8.21 | 2.297 | .704 | .816 |
CT2 | 8.28 | 2.113 | .772 | .750 |
CT3 | 8.10 | 2.462 | .705 | .816 |
Reliability Statistics
N of Items | |
.830 | 3 |
Item-Total Statistics
Scale Mean if Item Deleted | Scale Variance if Item Deleted | Corrected Item- Total Correlation | Cronbach's Alpha if Item Deleted | |
KH1 | 7.29 | 3.936 | .545 | .904 |
KH2 | 7.26 | 3.511 | .779 | .681 |
KH4 | 7.14 | 3.232 | .762 | .689 |
Reliability Statistics
N of Items | |
.769 | 3 |
Item-Total Statistics
Scale Mean if Item Deleted | Scale Variance if Item Deleted | Corrected Item- Total Correlation | Cronbach's Alpha if Item Deleted | |
HN2 | 7.97 | 3.012 | .594 | .698 |
HN3 | 7.78 | 2.898 | .712 | .570 |
HN4 | 8.24 | 3.140 | .513 | .790 |
4. KIỂM ĐỊNH HỆ SỐ TƯƠNG QUAN PEARSON
Ma trận tương quan giữa các biến
Correlations
CV | NV | LD | CT | KH | HN | VH | ||
CV | Pearson Correlation | 1 | .229** | .160* | .001 | -.008 | .206** | .273** |
Sig. (2-tailed) | .004 | .046 | .991 | .924 | .010 | .001 | ||
N | 156 | 156 | 156 | 156 | 156 | 156 | 156 | |
NV | Pearson Correlation | .229** | 1 | .264** | .198* | .064 | .333** | .628** |
Sig. (2-tailed) | .004 | .001 | .013 | .431 | .000 | .000 | ||
N | 156 | 156 | 156 | 156 | 156 | 156 | 156 | |
LD | Pearson Correlation | .160* | .264** | 1 | .079 | -.006 | .173* | .324** |
Sig. (2-tailed) | .046 | .001 | .326 | .936 | .031 | .000 | ||
N | 156 | 156 | 156 | 156 | 156 | 156 | 156 | |
CT | Pearson Correlation | .001 | .198* | .079 | 1 | -.006 | .004 | .263** |
Sig. (2-tailed) | .991 | .013 | .326 | .937 | .961 | .001 | ||
N | 156 | 156 | 156 | 156 | 156 | 156 | 156 | |
KH | Pearson Correlation | -.008 | .064 | -.006 | -.006 | 1 | .015 | .460** |
Sig. (2-tailed) | .924 | .431 | .936 | .937 | .850 | .000 | ||
N | 156 | 156 | 156 | 156 | 156 | 156 | 156 | |
HN | Pearson Correlation | .206** | .333** | .173* | .004 | .015 | 1 | .273** |
Sig. (2-tailed) | .010 | .000 | .031 | .961 | .850 | .001 | ||
N | 156 | 156 | 156 | 156 | 156 | 156 | 156 | |
VH | Pearson Correlation | .273** | .628** | .324** | .263** | .460** | .273** | 1 |
Sig. (2-tailed) | .001 | .000 | .000 | .001 | .000 | .001 | ||
N | 156 | 156 | 156 | 156 | 156 | 156 | 156 |
**. Correlation is significant at the 0.01 level (2-tailed).
*. Correlation is significant at the 0.05 level (2-tailed).
5. KẾT QUẢ PHÂN TÍCH HỒI QUI
Variables Entered/Removeda
Variables Entered | Variables Removed | Method | |
1 | HN, CT, KH, LD, CV, NVb | . | Enter |
a. Dependent Variable: VH
b. All requested variables entered.
Model Summaryb
R | R Square | Adjusted R Square | Std. Error of the Estimate | Durbin- Watson | |
1 | .802a | .642 | .628 | .27553 | 1.750 |
a. Predictors: (Constant), HN, CT, KH, LD, CV, NV
b. Dependent Variable: VH
ANOVAa
Sum of Squares | df | Mean Square | F | Sig. | ||
1 | Regression | 20.328 | 6 | 3.388 | 44.628 | .000b |
Residual | 11.311 | 149 | .076 | |||
Total | 31.639 | 155 |
a. Dependent Variable: VH
b. Predictors: (Constant), HN, CT, KH, LD, CV, NV
Coefficientsa
Unstandardized Coefficients | Standardized Coefficients | t | Sig. | Collinearity Statistics | ||||
B | Std. Error | Beta | Tolerance | VIF | ||||
1 | (Constant) | .727 | .247 | .130 | 2.942 | .004 | .918 | 1.089 |
CV | .080 | .031 | 2.551 | .012 | ||||
NV | .286 | .033 | .480 | 8.706 | .000 | .789 | 1.268 | |
LD | .118 | .038 | .158 | 3.071 | .003 | .912 | 1.096 | |
CT | .098 | .031 | .158 | 3.156 | .002 | .953 | 1.049 | |
KH | .215 | .025 | .431 | 8.782 | .000 | .995 | 1.005 | |
HN | .029 | .029 | .052 | .990 | .324 | .862 | 1.160 |
a. Dependent Variable: VH
Collinearity Diagnosticsa
Eigenvalue | Condition Index | Variance Proportions | ||||||||
Model | Dimension | (Constant) | CV | NV | LD | CT | KH | HN | ||
1 | 1 | 6.833 | 1.000 | .00 | .00 | .00 | .00 | .00 | .00 | .00 |
2 | .057 | 10.937 | .00 | .03 | .01 | .00 | .00 | .84 | .04 | |
3 | .036 | 13.774 | .00 | .05 | .00 | .00 | .46 | .03 | .32 | |
4 | .030 | 15.057 | .00 | .70 | .02 | .00 | .03 | .00 | .35 | |
5 | .020 | 18.537 | .00 | .07 | .65 | .07 | .24 | .00 | .25 | |
6 | .018 | 19.535 | .03 | .08 | .32 | .54 | .08 | .02 | .00 | |
7 | .006 | 32.679 | .97 | .07 | .00 | .38 | .18 | .10 | .04 |
a. Dependent Variable: VH
Residuals Statisticsa
Minimum | Maximum | Mean | Std. Deviation | N | |
Predicted Value | 2.8935 | 4.6870 | 4.0962 | .36214 | 156 |
Residual | -1.19490 | .66102 | .00000 | .27014 | 156 |
Std. Predicted Value | -3.321 | 1.631 | .000 | 1.000 | 156 |
Std. Residual | -4.337 | 2.399 | .000 | .980 | 156 |
a. Dependent Variable: VH
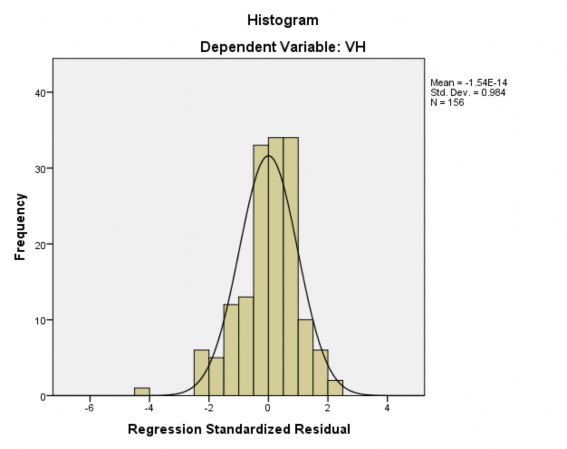
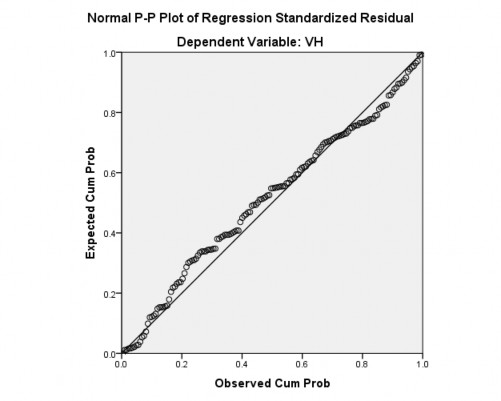
6. KIỂM TRA CÁC VI PHẠM TUYẾN TÍNH