a. Predictors: (Constant), nb REGR factor score 4 for analysis 1, HA REGR factor score 3 for analysis 1, Cl REGR factor score 2 for analysis 1, tt REGR factor score 1 for analysis 1
ANOVAa
Sum of Squares | df | Mean Square | F | Sig. | ||
Regression | 38.822 | 4 | 9.705 | 11.056 | .000b | |
1 | Residual | 250.178 | 285 | .878 | ||
Total | 289.000 | 289 |
Có thể bạn quan tâm!
-
 Hoàn Toàn Không Đồng Ý - 2: Không Đồng Ý - 3: Trung Lập - 4: Đồng Ý - 5: Hoàn Toàn Đồng Ý
 -
 Kết Quả Kiểm Định Độ Tin Cậy Thang Đo Cronbach Alpha
 -
 Vận dụng phương pháp thống kê đa biến đo lường tài sản thương hiệu điểm đến du lịch đất mũi Cà Mau theo cảm nhận của du khách nội địa - 12
Xem toàn bộ 104 trang tài liệu này.
a. Dependent Variable: y REGR factor score 1 for analysis 2
b. Predictors: (Constant), nb REGR factor score 4 for analysis 1, HA REGR factor score 3 for analysis 1, Cl REGR factor score 2 for analysis 1, tt REGR factor score 1 for analysis 1
Coefficientsa
Unstandardized Coefficients | Standardized Coefficients | t | Sig. | |||
B | Std. Error | Beta | ||||
(Constant) | 1.647E-016 | .055 | .000 | 1.000 | ||
tt REGR factor score 1 for analysis 1 | .300 | .055 | .300 | 5.439 | .000 | |
1 | Cl REGR factor score 2 for analysis 1 | .163 | .055 | .163 | 2.951 | .003 |
HA REGR factor score 3 for analysis 1 | .133 | .055 | .133 | 2.404 | .017 | |
nb REGR factor score 4 for analysis 1 | -.022 | .055 | -.022 | -.394 | .694 |
a. Dependent Variable: y REGR factor score 1 for analysis 2
KẾT QUẢ MÔ HÌNH HỒI QUY LẦN 2:
Model Summaryb
R | R Square | Adjusted R Square | Std. Error of the Estimate | |
1 | .366a | .134 | .625 | .93553467 |
a. Predictors: (Constant), HA REGR factor score 3 for analysis 1, Cl REGR factor score 2 for analysis 1, tt REGR factor score 1 for analysis 1
b. Dependent Variable: y REGR factor score 1 for analysis 2
ANOVAa
Sum of Squares | df | Mean Square | F | Sig. | ||
Regression | 38.686 | 3 | 12.895 | 14.734 | .000b | |
1 | Residual | 250.314 | 286 | .875 | ||
Total | 289.000 | 289 |
a. Dependent Variable: y REGR factor score 1 for analysis 2
b. Predictors: (Constant), HA REGR factor score 3 for analysis 1, Cl REGR factor score 2 for analysis 1, tt REGR factor score 1 for analysis 1
Coefficientsa
Unstandardized Coefficients | Standardized Coefficients | t | Sig. | |||
B | Std. Error | Beta | ||||
(Constant) | 1.644E-016 | .055 | .000 | 1.000 | ||
tt REGR factor score 1 for analysis 1 | .300 | .055 | .300 | 5.447 | .000 | |
1 | Cl REGR factor score 2 for analysis 1 | .163 | .055 | .163 | 2.955 | .003 |
HA REGR factor score 3 for analysis 1 | .133 | .055 | .133 | 2.408 | .017 |
a. Dependent Variable: y REGR factor score 1 for analysis 2
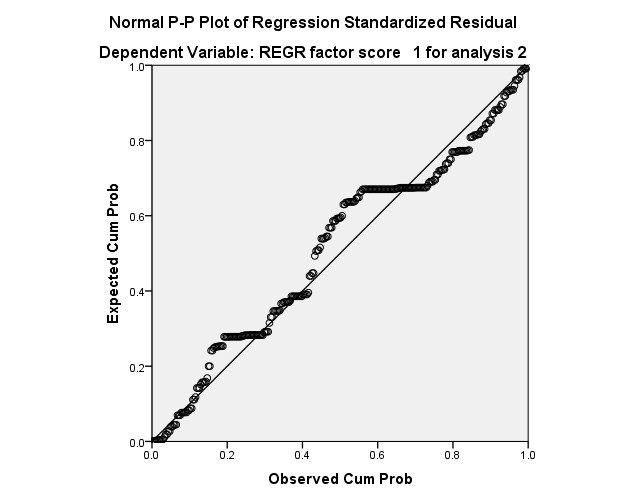
Residuals Statisticsa
Minimum | Maximum | Mean | Std. Deviation | N | |
Predicted Value | -1.6525092 | .6982232 | 0E-7 | .36586919 | 290 |
Residual | -3.01096249 | 2.55548954 | 0E-8 | .93066629 | 290 |
Std. Predicted Value | -4.517 | 1.908 | .000 | 1.000 | 290 |
Std. Residual | -3.218 | 2.732 | .000 | .995 | 290 |
a. Dependent Variable: y REGR factor score 1 for analysis 2


