Initial Eigenvalues | Extraction Sums of Squared Loadings | |||||
Total | % of Variance | Cumulative % | Total | % of Variance | Cumulative % | |
1 | 2.865 | 71.627 | 71.627 | 2.865 | 71.627 | 71.627 |
2 | .466 | 11.657 | 83.284 | |||
3 | .377 | 9.431 | 92.715 | |||
4 | .291 | 7.285 | 100.000 |
Có thể bạn quan tâm!
-

 Khám Phá Các Yếu Tố Ảnh Hưởng Đến Tiếp Cận Nguồn Vốn Tín Dụng Nh Của Dnnvv
 -
 A. Kết Quả Kiểm Định Hệ Số Tin Cậy Của Thang Đo Yếu Tố Từ Phía Dnnvv
 -
 B. Một Số Chính Sách Tín Dụng Ưu Đãi Dành Cho Dn Tại Các Nhtm
 -
 Tăng cường tiếp cận nguồn vốn tín dụng ngân hàng của doanh nghiệp nhỏ và vừa trên địa bàn tỉnh Thái Nguyên - 28
 -
 Tăng cường tiếp cận nguồn vốn tín dụng ngân hàng của doanh nghiệp nhỏ và vừa trên địa bàn tỉnh Thái Nguyên - 29
Xem toàn bộ 238 trang tài liệu này.
Extraction Method: Principal Component Analysis.
Component Matrixa
Component | |
1 | |
FI2 | .878 |
FI3 | .845 |
FI1 | .832 |
FI4 | .829 |
Extraction Method: Principal Component Analysis.
a. 1 components extracted.
Biến Quy mô của DN - SZ
Kaiser-Meyer-Olkin Measure of Sampling Adequacy. | .864 | |
Bartlett's Test of Sphericity | Approx. Chi-Square | 780.046 |
df | 10 | |
Sig. | .000 | |
Total Variance Explained
Initial Eigenvalues | Extraction Sums of Squared Loadings | |||||
Total | % of Variance | Cumulative % | Total | % of Variance | Cumulative % | |
1 | 3.404 | 68.088 | 68.088 | 3.404 | 68.088 | 68.088 |
2 | .566 | 11.324 | 79.412 | |||
3 | .457 | 9.140 | 88.552 | |||
4 | .299 | 5.972 | 94.524 | |||
5 | .274 | 5.476 | 100.000 |
Extraction Method: Principal Component Analysis.
Component Matrixa
Component | |
1 | |
SZ2 | .881 |
SZ5 | .867 |
SZ3 | .837 |
SZ4 | .782 |
SZ1 | .751 |
Extraction Method: Principal Component Analysis.
a. 1 components extracted.
Biến Phương án sản xuất kinh doanh của DN - BP
KMO and Bartlett's Test
.830 | ||
Bartlett's Test of Sphericity | Approx. Chi-Square | 535.688 |
df | 6 | |
Sig. | .000 |
Total Variance Explained
Initial Eigenvalues | Extraction Sums of Squared Loadings | |||||
Total | % of Variance | Cumulative % | Total | % of Variance | Cumulative % | |
1 | 2.833 | 70.836 | 70.836 | 2.833 | 70.836 | 70.836 |
2 | .437 | 10.929 | 81.765 | |||
3 | .378 | 9.454 | 91.219 | |||
4 | .351 | 8.781 | 100.000 |
Extraction Method: Principal Component Analysis.
Biến Trình độ của chủ DN - QU
KMO and Bartlett's Test
.834 | ||
Bartlett's Test of Sphericity | Approx. Chi-Square | 630.146 |
df | 21 | |
Sig. | .000 |
Total Variance Explained
Initial Eigenvalues | Extraction Sums of Squared Loadings | |||||
Total | % of Variance | Cumulative % | Total | % of Variance | Cumulative % | |
1 | 3.425 | 51.930 | 51.930 | 3.425 | 51.930 | 51.930 |
2 | .855 | 12.219 | 61.149 | |||
3 | .748 | 10.690 | 71.839 | |||
4 | .623 | 8.905 | 80.744 | |||
5 | .541 | 7.724 | 88.468 | |||
6 | .449 | 6.417 | 94.885 | |||
7 | .358 | 5.115 | 100.000 |
Extraction Method: Principal Component Analysis.
Component Matrixa
Component | |
1 | |
QU1 | .760 |
QU5 | .751 |
QU2 | .693 |
QU4 | .692 |
QU3 | .686 |
QU7 | .657 |
QU6 | .651 |
Extraction Method: Principal Component Analysis.
a. 1 components extracted.
Biến Tiếp cận vốn tín dụng NH của DNNVV AC
Kaiser-Meyer-Olkin Measure of Sampling Adequacy. | .805 |
Approx. Chi-Square | 425.864 | |
df | 6 | |
Sig. | .000 |
Total Variance Explained
Initial Eigenvalues | Extraction Sums of Squared Loadings | |||||
Total | % of Variance | Cumulative % | Total | % of Variance | Cumulative % | |
1 | 2.646 | 66.147 | 66.147 | 2.646 | 66.147 | 66.147 |
2 | .528 | 13.190 | 79.337 | |||
3 | .426 | 10.646 | 89.983 | |||
4 | .401 | 10.017 | 100.000 |
Extraction Method: Principal Component Analysis.
Component Matrixa
Component | |
1 | |
AC3 | .826 |
AC4 | .819 |
AC1 | .817 |
AC2 | .791 |
Extraction Method:
Principal Component Analysis.
a. 1 components extracted.
Phụ lục 9b. Phương sai trích các yếu tố từ phía DNNVV
Total Variance Explained
Initial Eigenvalues | Extraction Sums of Squared Loadings | Rotation Sums of Squared Loadings | |||||||
Total | % of Variance | Cumulative % | Total | % of Variance | Cumulative % | Total | % of Variance | Cumulative % | |
1 | 10.361 | 28.780 | 28.780 | 10.361 | 28.780 | 28.780 | 4.228 | 11.744 | 11.744 |
2 | 3.544 | 9.846 | 38.626 | 3.544 | 9.846 | 38.626 | 4.124 | 11.454 | 23.199 |
3 | 2.560 | 7.110 | 45.737 | 2.560 | 7.110 | 45.737 | 3.521 | 9.780 | 32.979 |
4 | 2.364 | 6.567 | 52.304 | 2.364 | 6.567 | 52.304 | 3.517 | 9.769 | 42.747 |
5 | 1.884 | 5.234 | 57.538 | 1.884 | 5.234 | 57.538 | 2.976 | 8.267 | 51.014 |
6 | 1.708 | 4.744 | 62.282 | 1.708 | 4.744 | 62.282 | 2.839 | 7.887 | 58.902 |
7 | 1.537 | 4.268 | 66.550 | 1.537 | 4.268 | 66.550 | 2.754 | 7.649 | 66.550 |
8 | .887 | 2.465 | 69.015 | ||||||
9 | .847 | 2.352 | 71.367 | ||||||
10 | .753 | 2.093 | 73.460 | ||||||
11 | .657 | 1.825 | 75.285 | ||||||
12 | .633 | 1.758 | 77.044 | ||||||
13 | .611 | 1.698 | 78.742 | ||||||
14 | .544 | 1.511 | 80.253 | ||||||
15 | .523 | 1.454 | 81.707 | ||||||
16 | .507 | 1.407 | 83.114 | ||||||
17 | .490 | 1.360 | 84.474 | ||||||
18 | .472 | 1.312 | 85.786 | ||||||
19 | .449 | 1.247 | 87.033 | ||||||
20 | .424 | 1.178 | 88.211 | ||||||
21 | .419 | 1.163 | 89.374 | ||||||
22 | .392 | 1.090 | 90.465 | ||||||
23 | .365 | 1.013 | 91.477 | ||||||
24 | .347 | .964 | 92.441 | ||||||
25 | .328 | .911 | 93.353 | ||||||
26 | .294 | .816 | 94.168 | ||||||
27 | .292 | .811 | 94.979 | ||||||
28 | .273 | .757 | 95.736 | ||||||
29 | .260 | .723 | 96.459 |
.252 | .699 | 97.159 | |
31 | .225 | .626 | 97.785 |
32 | .191 | .530 | 98.315 |
33 | .176 | .489 | 98.804 |
34 | .160 | .445 | 99.249 |
35 | .143 | .398 | 99.647 |
36 | .127 | .353 | 100.000 |
Extraction Method: Principal Component Analysis.
((Nguồn: Tính toán của tác giả bằng phần mềm SPSS 22.0)
Phụ lục 9c. Ma trận nhân tố xoay các yếu tố từ phía DNNVV
Component | |||||||
1 | 2 | 3 | 4 | 5 | 6 | 7 | |
CA6 | ,799 | ||||||
CA5 | ,792 | ||||||
CA4 | ,770 | ||||||
CA2 | ,765 | ||||||
CA1 | ,735 | ||||||
CA3 | ,718 | ||||||
CO3 | ,828 | ||||||
CO5 | ,808 | ||||||
CO6 | ,771 | ||||||
CO2 | ,724 | ||||||
CO4 | ,691 | ||||||
CO1 | ,642 | ||||||
SZ2 | ,870 | ||||||
SZ5 | ,860 | ||||||
SZ3 | ,821 | ||||||
SZ4 | ,757 | ||||||
SZ1 | ,640 | ||||||
QU5 | ,726 | ||||||
QU3 | ,694 | ||||||
QU2 | ,670 | ||||||
QU6 | ,667 | ||||||
QU4 | ,662 | ||||||
QU1 | ,661 | ||||||
QU7 | ,647 | ||||||
BP2 | ,832 | ||||||
BP3 | ,807 | ||||||
BP4 | ,764 | ||||||
BP1 | ,729 | ||||||
RE1 | ,833 | ||||||
RE2 | ,816 |
,721 | ||
RE3 | ,703 | |
FI3 | ,795 | |
FI4 | ,770 | |
FI2 | ,769 | |
FI1 | ,595 |
Extraction Method: Principal Component Analysis. Rotation Method: Varimax with Kaiser Normalization.a
a. Rotation converged in 6 iterations.
(Nguồn: Tính toán của tác giả bằng phần mềm SPSS 22.0)
Phụ lục 9d. Kết quả kiểm định phương sai phần dư thay đổi
Phụ lục 9d.1. Biểu đồ tần số phần dư chuẩn hóa Histogram
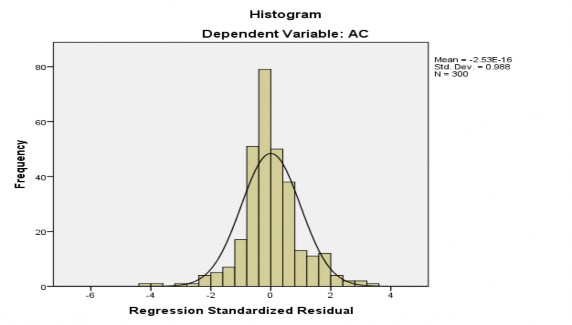
(Nguồn: Kết quả phân tích bằng phần mềm SPSS 22.0) Kết quả phân tích Biểu đồ tần số phần dư chuẩn hóa Histogram cho thấy một đường cong phân phối chuẩn được đặt chồng lên biểu đồ tần số. Đường cong này có dạng hình chuông, phù hợp với dạng đồ thị của phân phối chuẩn. Giá trị trung bình Mean là - 2,53E-16 gần bằng 0, độ lệch chuẩn là 0,988 gần bằng 1, như vậy có thể nói phân phối phần dư xấp xỉ chuẩn. Do đó, có thể kết luận rằng, giả thiết phân phối
chuẩn của phần dư không bị vi phạm.
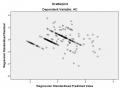
Phụ lục 9d.2. Biểu đồ phần dư chuẩn hóa Normal P-P Plot
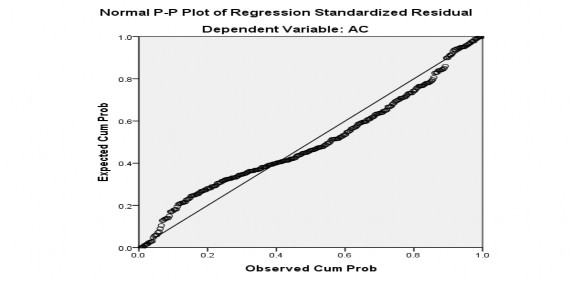
(Nguồn: Kết quả phân tích bằng phần mềm SPSS 22.0)