Total Variance Explained
Initial Eigenvalues | Extraction Sums of Squared Loadings | Rotation Sums of Squared Loadings | |||||||
Total | % of Varianc e | Cumula tive % | Total | % of Variance | Cumulati ve % | Total | % of Variance | Cumulative % | |
1 | 6.202 | 28.191 | 28.191 | 6.202 | 28.191 | 28.191 | 3.161 | 14.368 | 14.368 |
2 | 2.228 | 10.126 | 38.317 | 2.228 | 10.126 | 38.317 | 3.082 | 14.009 | 28.377 |
3 | 1.880 | 8.545 | 46.862 | 1.880 | 8.545 | 46.862 | 2.809 | 12.768 | 41.145 |
4 | 1.515 | 6.886 | 53.749 | 1.515 | 6.886 | 53.749 | 2.323 | 10.559 | 51.704 |
5 | 1.397 | 6.351 | 60.099 | 1.397 | 6.351 | 60.099 | 1.847 | 8.395 | 60.099 |
6 | .843 | 3.830 | 63.929 | ||||||
7 | .762 | 3.464 | 67.393 | ||||||
8 | .748 | 3.400 | 70.793 | ||||||
9 | .683 | 3.106 | 73.900 | ||||||
10 | .651 | 2.959 | 76.858 | ||||||
11 | .632 | 2.871 | 79.729 | ||||||
12 | .588 | 2.673 | 82.402 | ||||||
13 | .548 | 2.489 | 84.892 | ||||||
14 | .486 | 2.210 | 87.102 | ||||||
15 | .470 | 2.135 | 89.237 | ||||||
16 | .389 | 1.769 | 91.007 | ||||||
17 | .387 | 1.761 | 92.767 | ||||||
18 | .373 | 1.695 | 94.463 | ||||||
19 | .330 | 1.498 | 95.961 | ||||||
20 | .315 | 1.431 | 97.392 | ||||||
21 | .310 | 1.409 | 98.800 | ||||||
22 | .264 | 1.200 | 100.00 0 |
Có thể bạn quan tâm!
-

 Kết Quả Thảo Luận Chuyên Gia Về Các Yếu Tố Chất Lượng Dịch Vụ Du Lich Ảnh Hưởng Đến Sự Hài Lòng Của Du Khách Tại Tp.hcm
 -
 Tác động chất lượng dịch vụ du lịch đến sự hài lòng của du khách tại TP.HCM - 14
 -
 Tác động chất lượng dịch vụ du lịch đến sự hài lòng của du khách tại TP.HCM - 15
Xem toàn bộ 130 trang tài liệu này.
Rotated Component Matrixa
Component | |||||
1 | 2 | 3 | 4 | 5 | |
TC1 | .091 | .660 | .219 | .092 | -.151 |
TC2 | .226 | .727 | .086 | -.009 | .099 |
TC3 | .243 | .729 | .187 | .094 | -.034 |
TC4 | .190 | .723 | .252 | -.022 | .097 |
TC5 | .314 | .752 | .194 | .078 | .047 |
DU1 | .163 | .136 | .722 | .126 | -.031 |
DU2 | .038 | .190 | .761 | .111 | -.007 |
DU3 | .196 | .150 | .705 | -.026 | .112 |
DU4 | .093 | .280 | .588 | -.031 | -.051 |
DU5 | .315 | .093 | .667 | -.036 | -.099 |
NLPV1 | .160 | -.012 | -.013 | .840 | .005 |
NLPV2 | .117 | .160 | .114 | .845 | -.033 |
NLPV3 | .019 | .033 | .029 | .879 | -.064 |
DC1 | -.030 | .102 | .025 | .019 | .752 |
DC2 | .135 | -.033 | -.096 | -.069 | .764 |
DC3 | -.022 | -.041 | .023 | -.033 | .783 |
PTHH1 | .573 | .390 | .055 | .149 | -.013 |
PTHH2 | .670 | .215 | .151 | -.034 | .006 |
PTHH3 | .708 | .146 | .039 | .014 | .024 |
PTHH4 | .776 | .200 | .164 | .083 | -.006 |
PTHH5 | .604 | .140 | .186 | .125 | .028 |
DU6 | .655 | .119 | .340 | .151 | .081 |
Extraction Method: Principal Component Analysis. Rotation Method: Varimax with Kaiser Normalization.
a. Rotation converged in 6 iterations.
Kaiser-Meyer-Olkin Measure of Sampling Adequacy. | .720 | |
Bartlett's Test of Sphericity | Approx. Chi-Square | 220.882 |
df | 6 | |
Sig. | .000 | |
Phụ lục 7: Kết quả phân tích nhân tố thành phần sự hài lòng KMO and Bartlett's Test
Total Variance Explained
Initial Eigenvalues | Extraction Sums of Squared Loadings | |||||
Total | % of Variance | Cumulative % | Total | % of Variance | Cumulative % | |
1 | 2.283 | 57.066 | 57.066 | 2.283 | 57.066 | 57.066 |
2 | .745 | 18.613 | 75.678 | |||
3 | .618 | 15.447 | 91.125 | |||
4 | .355 | 8.875 | 100.000 |
Component Matrixa
Component | |
1 | |
HL1 | .782 |
HL2 | .866 |
HL3 | .724 |
HL4 | .631 |
Phụ lục 8: Ma trận tương quan biến
TC | DU | PTHH | DC | NLPV | HL | ||
TC | Pearson Correlation | 1 | .497** | .561** | .037 | .168* | .613** |
Sig. (2-tailed) | .000 | .000 | .581 | .011 | .000 | ||
N | 227 | 227 | 227 | 227 | 227 | 227 | |
DU | Pearson Correlation | .497** | 1 | .467** | -.021 | .135* | .630** |
Sig. (2-tailed) | .000 | .000 | .757 | .042 | .000 | ||
N | 227 | 227 | 227 | 227 | 227 | 227 | |
PTHH | Pearson Correlation | .561** | .467** | 1 | .052 | .236** | .611** |
Sig. (2-tailed) | .000 | .000 | .432 | .000 | .000 | ||
N | 227 | 227 | 227 | 227 | 227 | 227 | |
DC | Pearson Correlation | .037 | -.021 | .052 | 1 | -.061 | .137* |
Sig. (2-tailed) | .581 | .757 | .432 | .359 | .040 | ||
N | 227 | 227 | 227 | 227 | 227 | 227 | |
NLPV | Pearson Correlation | .168* | .135* | .236** | -.061 | 1 | .240** |
Sig. (2-tailed) | .011 | .042 | .000 | .359 | .000 | ||
N | 227 | 227 | 227 | 227 | 227 | 227 | |
HL | Pearson Correlation | .613** | .630** | .611** | .137* | .240** | 1 |
Sig. (2-tailed) | .000 | .000 | .000 | .040 | .000 | ||
N | 227 | 227 | 227 | 227 | 227 | 227 | |
**. Correlation is significant at the 0.01 level (2-tailed). | |||||||
*. Correlation is significant at the 0.05 level (2-tailed). | |||||||
Model | Variables Entered | Variables Removed | Method |
1 | NLPV, DC, DU, PTHH, TCa | . | Enter |
Phụ lục 9: Kết quả phân tích hồi quy Variables Entered/Removedb
a. All requested variables entered.
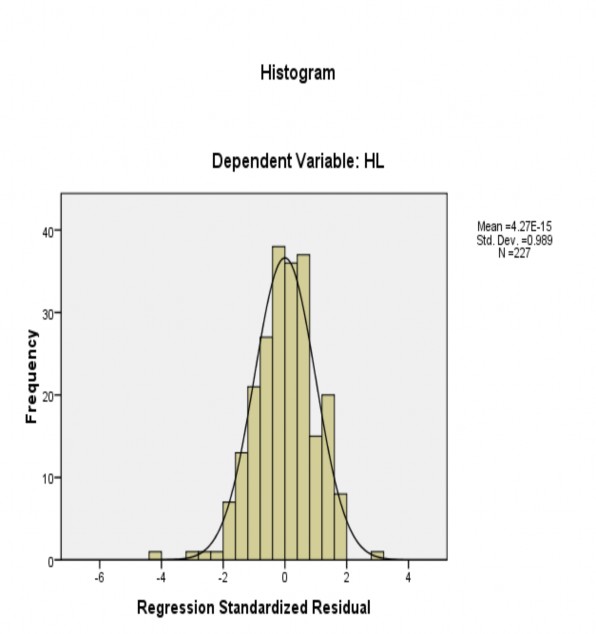
b. Dependent Variable: HL
Model Summaryb
Model | ||
1 | ||
R | .770a | |
R Square | .593 | |
Adjusted R Square | .583 | |
Std. Error of the Estimate | .45341 | |
Change Statistics | R Square Change | .593 |
F Change | 64.302 | |
df1 | 5 | |
df2 | 221 | |
Sig. F Change | .000 | |
Durbin-Watson | 2.038 | |
Model | Sum of Squares | df | Mean Square | F | Sig. | |
1 | Regression | 66.097 | 5 | 13.219 | 64.302 | .000a |
Residual | 45.434 | 221 | .206 | |||
Total | 111.531 | 226 | ||||
a. Predictors: (Constant), NLPV, DC, DU, PTHH, TC | ||||||
b. Dependent Variable: HL | ||||||
Coefficientsa
Unstandardized Coefficients | Standardized Coefficients | t | Sig. | Collinearity Statistics | ||||
B | Std. Error | Beta | Tolerance | VIF | ||||
1 | (Constant) | -.861 | .287 | -3.002 | .003 | |||
TC | .257 | .054 | .263 | 4.800 | .000 | .613 | 1.631 | |
DU | .408 | .057 | .366 | 7.119 | .000 | .699 | 1.431 | |
PTHH | .306 | .063 | .265 | 4.850 | .000 | .619 | 1.615 | |
DC | .141 | .048 | .126 | 2.921 | .004 | .988 | 1.012 | |
NLPV | .063 | .030 | .092 | 2.073 | .039 | .937 | 1.067 |