6.Mẫu vi khuẩn VBt2119.1
GTTTCCCCACACACATTTCCGTACCGGTACTCGAGATTACACTTGAAAATTA TCCAAGAGATTATTCTAATTATTGAATAAATACGTATCAAATTGCGTTAAA AGGTTTAAACACCCGTTAACACAATATGTTAAAATTTAAAACATATATGTT TTTAAATGTATTTGATTATGTATCCATTTGGTCTTTGTTAAAATATCAAAGT CTTCTGGTATCTTCGGGTGCTAATTTATATGCAAGTGGTAGTGAACCACAG CAAACCCAATCATTTACTTCACAAAACTGGCCATTTTAATATTCTCTTTTCC AAGTTAATTCAAATTATGTGTTAAATGGATTTAGGGGTGCTAGGCTTTCTAT TACCTTCCCTAATATGGTTGGTTTACCGGGTTCTACTACAACTCATTCATTG ATTGCTGCAAGGGTTAATTACAGTGAAGGAATTTCTTCGGGTGAAATAGGG GCACCTCCTTTAAATCAAAATTTTAATTGCAGCACATTTCCCCCCCCTTTGT TAACCCCATTTGTTAGAAGTTGGCTGGATTCAGGTCCAAATCGGGAGGGCG TTGCCACCTTTACAAATTGCCAAACAAAATCCTTTAAAACAACTTTAGGTTT AAGGAGGGGGGCTTTTCCACCCCGGGGAAATTCAAACTATTTCCCATATTT TTATCCGGAACAAAAAAA
7. Mẫu Vi khuẩn VBt2639.5
GGCCGCAATAATCCAATAGCAAGTGCTCATCCGCCATGTTACANCACCTAT CGTCGTAATACCGGAAACAGCAATATAATAAAGTAGCCCAACTCCAATATC TGCAAATTGAAATTTATCAGTGAACGGGATAACTGCAAGCACCATAAATGC TGGCGCAAATGCAATGACAGGCGCTAATATAAACAGCGGTTTATCTGCTGC TTTTGGAATACTATCTTCTTTCAATAATAGTTTTAAAACATCAGCTACCGTT TGCAGTAAACCGAATCGGCCTCCAACCTGGTTTGGTCCAATCCGCCCTCGC TAATAGTAACACCGAGATGTGTTGACTGTTTGAGC
PHỤ LỤC 4.
PHÂN TÍCH THỐNG KÊ
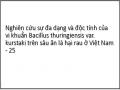
Bảng 25. Bảng Anova kết quả phân tích thống kê đánh giá hiệu quả của các dòng vi khuẩn B. thuringiensis var. kurstaki phòng trừ sâu tơ trong phòng thí nghiệm
Sum of Squares | Df | Mean Square | F | Sig. | |||
1 ngày sau phun | Between Groups | 52.238 | 20 | 2.612 | 3.501 | .000 | |
Within Groups | 47.000 | 63 | .746 | ||||
Total | 99.238 | 83 | |||||
3 ngày sau phun | Between Groups | 120.452 | 20 | 6.023 | 5.883 | .000 | |
Within Groups | 64.500 | 63 | 1.024 | ||||
Total | 184.952 | 83 | |||||
5 ngày sau phun | Between Groups | 265.643 | 20 | 13.282 | 21.319 | .000 | |
Within Groups | 39.250 | 63 | .623 | ||||
Total | 304.893 | 83 | |||||
7 ngày sau phun | Between Groups | 276.238 | 20 | 13.812 | 32.529 | .000 | |
Within Groups | 26.750 | 63 | .425 | ||||
Total | 302.988 | 83 |
Có thể bạn quan tâm!
-
 Wellman-Desbiens, E., Cote, J.c., 2005. Development Of A Bacillus Thuringiensis-Based Assay On Lygus Hesperus. Journal Of Economic Entomology 98, 1469 – 1479.
 -
 Đặc Điểm Khuẩn Lạc, Tinh Thể Và Gen Độc Của Các Chủng Vi Khuẩn Bacillus Thuringiensis
 -
 Thí Nghiệm Đánh Giá Hiệu Quả Của Các Dòng Vi Khuẩn Trong Điều Kiện Nhà
 -
 Bảng Anova Kết Quả Phân Tích Lt50 Sâu Tơ Tuổi 2 Và 4
 -
 Bảng Anova Kết Quả Phân Tích Hai Dòng Vi Khuẩn Vbt2110.1 Và Vbt26310.1 Phòng Trừ Sâu Tơ Trong Điều Kiện Phòng Thí Nghiệm
 -
 C Hiệu Quả Gây Chết (%) Sâu Tơ Của Các Chủng Vi Khuẩn Đã Được Chiếu Tia Uv
Xem toàn bộ 262 trang tài liệu này.
Bảng 26. Bảng Anova kết quả phân tích thống kê đánh giá hiệu quả của các dòng vi khuẩn B. thuringiensis var. kurstaki phòng trừ sâu khoang trong phòng thí nghiệm
Sum of Squares | Df | Mean Square | F | Sig. | |||
1 ngày sau phun | Between Groups | 77.810 | 20 | 3.890 | 6.166 | .000 | |
Within Groups | 39.750 | 63 | .631 | ||||
Total | 117.560 | 83 | |||||
3 ngày sau phun | Between Groups | 159.452 | 20 | 7.973 | 11.613 | .000 | |
Within Groups | 43.250 | 63 | .687 | ||||
Total | 202.702 | 83 | |||||
5 ngày sau phun | Between Groups | 197.571 | 20 | 9.879 | 14.818 | .000 | |
Within Groups | 42.000 | 63 | .667 | ||||
Total | 239.571 | 83 | |||||
7 ngày sau phun | Between Groups | 252.738 | 20 | 12.637 | 23.245 | .000 | |
Within Groups | 34.250 | 63 | .544 | ||||
Total | 286.988 | 83 |
Bảng 27. Bảng Anova kết quả phân tích thống kê đánh giá hiệu quả của các dòng vi khuẩn B. thuringiensis var. kurstaki phòng trừ sâu xanh da láng trong phòng thí nghiệm
Sum of Squares | Df | Mean Square | F | Sig. | |||
1 ngày sau phun | Between Groups | 48.310 | 20 | 2.415 | 5.339 | .000 | |
Within Groups | 28.500 | 63 | .452 | ||||
Total | 76.810 | 83 | |||||
3 ngày sau phun | Between Groups | 100.643 | 20 | 5.032 | 7.124 | .000 | |
Within Groups | 44.500 | 63 | .706 | ||||
Total | 145.143 | 83 | |||||
5 ngày sau phun | Between Groups | 258.667 | 20 | 12.933 | 25.663 | .000 | |
Within Groups | 31.750 | 63 | .504 | ||||
Total | 290.417 | 83 | |||||
7 ngày sau phun | Between Groups | 274.643 | 20 | 13.732 | 28.365 | .000 | |
Within Groups | 30.500 | 63 | .484 | ||||
Total | 305.143 | 83 |
Kết quả phân tích LC50 sâu tơ tuổi 2
------------------------------------------------------------------------
Intercepts and slopes unconstrained. Preparation is ( 1) LD20.2 Not estimating natural response
parameter standard error t ratio LD20.2 -1.200 0.489 -2.453
SLOPE 0.223 0.056 3.998
Variance-Covariance matrix
LD20.2 SLOPE LD20.2 0.239114 -0.264764E-01 SLOPE -0.264764E-01 0.310638E-02
Chi-squared goodness of fit test
n | r | expected | residual | probab | std resid | |
LD20.2 1591623.037 | 40. | 24. | 22.89 | 1.108 | 0.572 | 0.354 |
159162303.700 | 40. | 28. | 29.40 | -1.398 | 0.735 | -0.501 |
************* | 40. | 34. | 34.34 | -0.339 | 0.858 | -0.154 |
************* | 40. | 38. | 37.43 | 0.575 | 0.936 | 0.370 |
chi-square: 0.537 degrees of freedom: 2 heterogeneity: 0.268 Effective Doses
dose limits 0.90 0.95 0.99
LD50 LD20.2 0.24206E+06 lower 846.42 112.38 0.18966
upper 0.36372E+07 0.53764E+07 0.10790E+08
------------------------------------------------------------------------
Intercepts and slopes unconstrained. Preparation is ( 2) TN36.4 Not estimating natural response
parameter standard . Preparation is ( 3) BT1.3 Not estimating natural response
parameter standard . Preparation is ( 4) VP4.1 Not estimating natural response
parameter standard error t ratio
-1.251 | 0.445 | -2.814 | |
SLOPE | 0.192 | 0.049 | 3.896 |
Variance-Covariance matrix
VP4.1 SLOPE VP4.1 0.197687 -0.212959E-01 SLOPE -0.212959E-01 0.243402E-02
Chi-squared goodness of fit test
dose | n | r | expected | residual | probab | std resid | |
VP4.1 | 1242105.263 | 40. | 19. | 18.73 | 0.274 | 0.468 | 0.087 |
124210526.300 | 40. | 25. | 24.78 | 0.215 | 0.620 | 0.070 | |
************* | 40. | 29. | 30.18 | -1.182 | 0.755 | -0.434 | |
************* | 40. | 35. | 34.34 | 0.663 | 0.858 | 0.301 |
chi-square: 0.291 degrees of freedom: 2 heterogeneity: 0.146 Effective Doses
dose limits 0.90 0.95 0.99
LD50 VP4.1 0.32358E+07 lower 31305. 6125.7 33.365
upper 0.35711E+08 0.51897E+08 0.10428E+09
Kết quả phân tích LC50 sâu tơ tuổi 4
------------------------------------------------------------------------
Intercepts and slopes unconstrained. Preparation is ( 1) LD20.2 Not estimating natural response
parameter standard . Preparation is ( 2) TN36.4 Not estimating natural response
parameter | standard error | t ratio | |
TN36.4 | -1.263 | 0.427 | -2.957 |
SLOPE | 0.188 | 0.048 | 3.894 |
Variance-Covariance matrix
TN36.4 SLOPE TN36.4 0.182534 -0.200281E-01 SLOPE -0.200281E-01 0.233885E-02
Chi-squared goodness of fit test
n | r | expected | residual | probab | std resid | |
TN36.4 704433.498 | 40. | 19. | 17.43 | 1.574 | 0.436 | 0.502 |
70443349.750 | 40. | 21. | 23.40 | -2.399 | 0.585 | -0.770 |
************* | 40. | 29. | 28.91 | 0.086 | 0.723 | 0.030 |
************* | 40. | 34. | 33.34 | 0.661 | 0.833 | 0.280 |
chi-square: 0.924 degrees of freedom: 2 heterogeneity: 0.462 Effective Doses
dose limits 0.90 0.95 0.99
LD50 TN36.4 0.51057E+07 lower 82184. 19966. 230.45
upper 0.49626E+08 0.71984E+08 0.14721E+09
------------------------------------------------------------------------
Intercepts and slopes unconstrained. Preparation is ( 3) BT1.3 Not estimating natural response
parameter standard . Preparation is ( 4) VP4.1 Not estimating natural response
parameter standard error t ratio VP4.1 -1.331 0.432 -3.082
SLOPE 0.171 0.047 3.641
Variance-Covariance matrix
VP4.1 SLOPE VP4.1 0.186463 -0.196622E-01 SLOPE -0.196622E-01 0.219722E-02
Chi-squared goodness of fit test
dose | n | r | expected | residual | probab | std resid | |
VP4.1 | 1242105.263 | 40. | 16. | 15.42 | 0.577 | 0.386 | 0.187 |
124210526.300 | 40. | 21. | 20.81 | 0.195 | 0.520 | 0.062 | |
************* | 40. | 24. | 26.10 | -2.096 | 0.652 | -0.696 | |
************* | 40. | 32. | 30.73 | 1.269 | 0.768 | 0.476 |
chi-square: 0.750 degrees of freedom: 2 heterogeneity: 0.375 Effective Doses
dose limits 0.90 0.95 0.99
LD50 VP4.1 0.62859E+08 lower 0.16510E+07 0.48115E+06
upper 0.61535E+09 0.94599E+09
------------------------------------------------------------------------
Kết quả phân tích LC50 sâu khoang tuổi 2
Intercepts and slopes unconstrained. Preparation is ( 1) Bt-20.2 Not estimating natural response
standard . Preparation is ( 2) Bt-36.4 Not estimating natural response
Variance-Covariance matrix Bt-36.4 SLOPE Bt-36.4 0.130515 -0.160559E-01 SLOPE -0.160559E-01 0.215666E-02 Chi-squared goodness of fit test
Ngày đăng: 19/02/2023 | ||||||