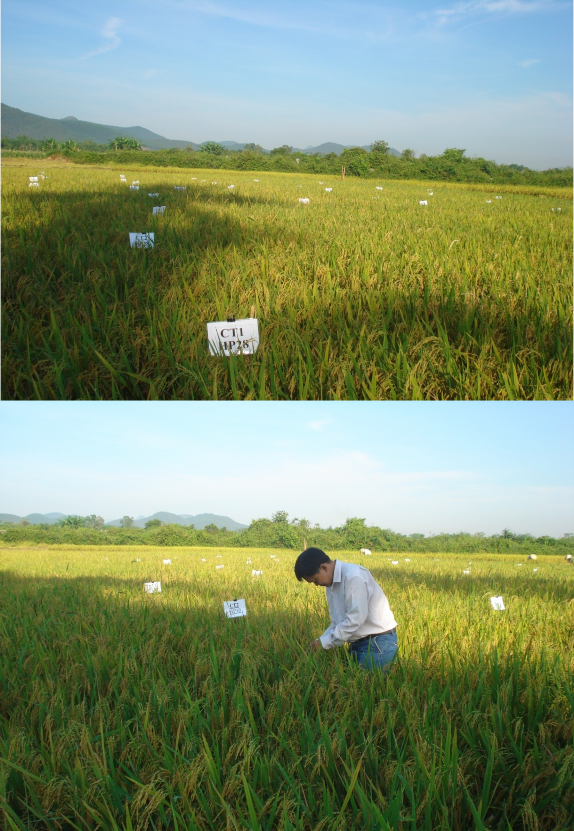
Hình 4: Thí nghiệm đánh giá khả năng kháng rầy nâu của các giống lúa nghiên cứu tại Hương An, Hương Trà, Thừa Thiên Huế
Hình 5: Các giống lúa HP28; HP10; HP07 của đề tài nghiên cứu tham dự Hội chợ triển lãm KHCN Đại học Huế năm 2014
Phụ lục 3: Một số kết quả xử lý thống kê thí nghiệm
* Xử lý thống kê: các công thức phân bón ảnh hưởng đến các yếu tố cấu thành năng suất và năng suất của giống lúa HP28 tại Hương Trà trong vụ Hè Thu
SỐ BÔNG/M2
Descriptive Statistics
sobong
N 18
Mean 354.33
SD 29.746
C.V. 8.3949
Minimum 316.00
Maximum 394.00
Randomized Complete Block AOV Table for sobong Source DF SS MS F P LNL 2 13.0 6.50
14778.0 | 2955.60 117.75 | 0.0000 | |
Error 10 | 251.0 | 25.10 | |
Total 17 | 15042.0 |
Có thể bạn quan tâm!
-
 Biểu Đồ Năng Suất Của Các Công Thức Thí Nghiệm Tại Phú Vang, Thừa Thiên Huế
 -
 Nghiên cứu phát triển giống lúa kháng rầy nâu Nilaparvata Lugens Stal ở Thừa Thiên Huế - 19
 -
 Một Số Kết Quả Điều Tra Thành Phần Và Diễn Biến Sâu, Bệnh Hại Trên Các Giống Lúa Nghiên Cứu Tại Hương Trà Và Phú Vang Trong Vụ Đông Xuân
 -
 Nghiên cứu phát triển giống lúa kháng rầy nâu Nilaparvata Lugens Stal ở Thừa Thiên Huế - 22
Xem toàn bộ 176 trang tài liệu này.
Grand Mean 354.33 CV 1.41
Tukey's 1 Degree of Freedom Test for Nonadditivity Source DF SS MS F P Nonadditivity 1 0.423 0.4227 0.02 0.9046
Remainder 9 250.577 27.8419
Relative Efficiency, RCB 0.89
Means of sobong for CT CT Mean
1 331.00
2 382.33
3 320.33
4 376.00
5 327.00
6 389.33
Observations per Mean 3
Standard Error of a Mean 2.8925 Std Error (Diff of 2 Means) 4.0906
LSD All-Pairwise Comparisons Test of sobong for CT CT Mean Homogeneous Groups
6 389.33 A
2 382.33 AB
4 376.00 B
1 331.00 C
5 327.00 CD
3 320.33 D
Alpha 0.05 Standard Error for Comparison 4.0906
Critical T Value 2.228 Critical Value for Comparison 9.1145
Error term used: LNL*CT, 10 DF
There are 4 groups (A, B, etc.) in which the means are not significantly different from one another. SỐ HẠT/BÔNG
Descriptive Statistics
sohat
N 18
Mean 84.678
SD 3.3476
C.V. 3.9534
Minimum 77.400
Maximum 90.400
andomized Complete Block AOV Table for sohat
DF | SS | MS | F | P | |
LNL | 2 | 25.671 | 12.8356 | ||
CT | 5 | 70.071 | 14.0142 | 1.48 | 0.2794 |
Error | 10 | 94.769 | 9.4769 | ||
Total | 17 | 190.511 |
Grand Mean 84.678 CV 3.64
Tukey's 1 Degree of Freedom Test for Nonadditivity Source DF SS MS F P Nonadditivity 1 0.4516 0.4516 0.04 0.8402
Remainder 9 94.3173 10.4797 Relative Efficiency, RCB 1.02
Means of sohat for CT CT Mean
1 83.867
2 87.700
3 81.600
4 85.233
5 83.467
6 86.200
Observations per Mean 3
Standard Error of a Mean 1.7773 Std Error (Diff of 2 Means) 2.5135
LSD All-Pairwise Comparisons Test of sohat for CT CT Mean Homogeneous Groups
2 87.700 A
6 86.200 AB
4 85.233 AB
1 83.867 AB
5 83.467 AB
3 81.600 B
Alpha 0.05 Standard Error for Comparison 2.5135 Critical T Value 2.228 Critical Value for Comparison 5.6005 Error term used: LNL*CT, 10 DF
There are 2 groups (A and B) in which the means are not significantly different from one another. SỐ HẠT CHẮC/BÔNG
Descriptive Statistics
hatchac
N 18
Mean 63.444
SD 3.9354
C.V. 6.2029
Minimum 56.600
Maximum 71.300
Randomized Complete Block AOV Table for hatchac
SS | MS | F | P | ||
LNL 2 | 2.991 | 1.4956 | |||
CT 5 | 152.164 | 30.4329 | 2.81 | 0.0769 | |
Error 10 | 108.129 | 10.8129 | |||
Total 17 | 263.284 | ||||
Grand Mean 63.444 CV 5.18 Tukey's 1 Degree of Freedom Test | for Nonadditivity | ||||
Source DF | SS MS | F | P | ||
Nonadditivity 1 | 43.9423 43.9423 | 6.16 | 0.0349 | ||
Remainder 9 | 64.1866 7.1318 | ||||
Relative Efficiency, RCB 0.88 Means of hatchac for CT | |||||
CT Mean
1 63.533
2 67.167
3 58.633
4 66.433
5 63.633
6 61.267
Observations per Mean 3
Standard Error of a Mean 1.8985 Std Error (Diff of 2 Means) 2.6849
LSD All-Pairwise Comparisons Test of hatchac for CT CT Mean Homogeneous Groups
2 67.167 A
4 66.433 A
5 63.633 AB
1 63.533 AB
6 61.267 AB
3 58.633 B
Alpha 0.05 Standard Error for Comparison 2.6849 Critical T Value 2.228 Critical Value for Comparison 5.9823 Error term used: LNL*CT, 10 DF
There are 2 groups (A and B) in which the means are not significantly different from one another. P1000 HẠT
Descriptive Statistics
P1000
N 18
Mean 25.483
SD 0.2895
C.V. 1.1361
Minimum 24.900
Maximum 25.900
LNL | 2 | 0.14333 | 0.07167 | |
CT | 5 | 0.75167 | 0.15033 2.84 | 0.0755 |
Error | 10 | 0.53000 | 0.05300 | |
Total | 17 | 1.42500 |
Randomized Complete Block AOV Table for P1000 Source DF SS MS F P
Grand Mean 25.483 CV 0.90
Tukey's 1 Degree of Freedom Test for Nonadditivity Source DF SS MS F P Nonadditivity 1 0.17108 0.17108 4.29 0.0682
Remainder 9 0.35892 0.03988 Relative Efficiency, RCB 1.02
Means of P1000 for CT CT Mean
1 25.533
2 25.733
3 25.567
4 25.133
5 25.300
6 25.633
Observations per Mean 3
Standard Error of a Mean 0.1329
Std Error (Diff of 2 Means) 0.1880
LSD All-Pairwise Comparisons Test of P1000 for CT CT Mean Homogeneous Groups
2 25.733 A
6 25.633 AB
3 25.567 AB
1 25.533 ABC
5 25.300 BC
4 25.133 C
0.1880 | ||
Critical T Value 2.228 | Critical Value for Comparison | 0.4188 |
Error term used: LNL*CT, | 10 DF |
Alpha 0.05
There are 3 groups (A, B, etc.) in which the means are not significantly different from one another. NĂNG SUẤT LÝ THUYẾT
Descriptive Statistics
NSLT
N 18
Mean 57.367
SD 6.8682
C.V. 11.972
Minimum 46.300
Maximum 70.000
Randomized Complete Block AOV Table for NSLT Source DF SS MS F P LNL 2 1.853 0.927
CT 5 724.967 144.993 19.31 0.0001
Error 10 75.100 7.510
Total 17 801.920
Grand Mean 57.367 CV 4.78
Tukey's 1 Degree of Freedom Test for Nonadditivity Source DF SS MS F P Nonadditivity 1 22.8618 22.8618 3.94 0.0785
Remainder 9 52.2382 5.8042 Relative Efficiency, RCB 0.88
Means of NSLT for CT CT Mean
1 53.700
2 66.067
3 48.000
4 62.700
5 52.633
6 61.100
Observations per Mean 3
Standard Error of a Mean 1.5822 Std Error (Diff of 2 Means) 2.2376
LSD All-Pairwise Comparisons Test of NSLT for CT CT Mean Homogeneous Groups
2 66.067 A
4 62.700 A
6 61.100 A
1 53.700 B
5 52.633 BC
3 48.000 C
Alpha 0.05 Standard Error for Comparison 2.2376 Critical T Value 2.228 Critical Value for Comparison 4.9856 Error term used: LNL*CT, 10 DF
There are 3 groups (A, B, etc.) in which the means are not significantly different from one another. NĂNG SUẤT THỰC THU
Descriptive Statistics
NSTT
N 18
Mean 43.828
SD 2.8178
C.V. 6.4292
Minimum 38.900
Maximum 47.800
Randomized Complete Block AOV Table for NSTT
Source DF SS MS F P
LNL 2 58.351 29.1756
CT 5 51.783 10.3566 4.17 0.0262
Error 10 24.842 2.4842
Total 17 134.976
Grand Mean 43.828 CV 3.60
Tukey's 1 Degree of Freedom Test for Nonadditivity Source DF SS MS F P Nonadditivity 1 8.079E-06 0.00001 0.00 0.9987
Remainder 9 24.8422 2.76025 Relative Efficiency, RCB 2.21
Means of NSTT for CT CT Mean
1 44.433
2 45.933
3 40.733
4 44.433
5 44.833
6 42.600
Observations per Mean 3
Standard Error of a Mean 0.9100 Std Error (Diff of 2 Means) 1.2869
LSD All-Pairwise Comparisons Test of NSTT for CT CT Mean Homogeneous Groups
2 45.933 A
5 44.833 AB
1 44.433 AB
4 44.433 AB
6 42.600 BC
3 40.733 C
Alpha 0.05 Standard Error for Comparison 1.2869 Critical T Value 2.228 Critical Value for Comparison 2.8674 Error term used: LNL*CT, 10 DF
There are 3 groups (A, B, etc.) in which the means are not significantly different from one another.
1 SỐ BÔNG/M2 | ||
Statistix - 30 Day Trial Version | 9.0 | |
1:43:22 PM | ||
One-Way AOV for bongm by ct | ||
Source DF SS MS | F | P |
ct 5 10808.7 2161.73 | 22.69 | 0.0000 |
Error 12 1143.3 95.28 | ||
Total 17 11952.0 | ||
Grand Mean 362.67 CV 2.69 | ||
Homogeneity of Variances F | P | |
Levene's Test 2.42 | 0.0973 | |
O'Brien's Test 1.08 | 0.4208 | |
Brown and Forsythe Test 0.80 | 0.5687 |
* Xử lý thống kê các công thức thí nghiệm phân bón ảnh hưởng đến các yếu tố cấu thành năng suất và năng suất của giống lúa HP28 tại Hương Trà trong vụ Đông Xuân
7/22/2013,
Welch's Test for Mean Differences Source DF F P
ct 5.0 33.39 0.0005
Error 5.4
Component of variance for between groups 688.819
Effective cell size 3.0
ct Mean
1 352.00
2 409.33
3 339.00
4 352.00
5 344.00
6 379.67
Observations per Mean 3
Standard Error of a Mean 5.6355 Std Error (Diff of 2 Means) 7.9699
Statistix - 30 Day Trial Version 9.0 7/22/2013, 1:43:49 PM
LSD All-Pairwise Comparisons Test of bongm by ct ct Mean Homogeneous Groups
2 409.33 A
6 379.67 B
1 352.00 C
4 352.00 C
5 344.00 C
3 339.00 C
Alpha 0.05 Standard Error for Comparison 7.9699 Critical T Value 2.179 Critical Value for Comparison 17.365
There are 3 groups (A, B, etc.) in which the means are not significantly different from one another.
4.2 SỐ HẠT/BÔNG
Statistix - 30 Day Trial Version 9.0 7/22/2013, 5:38:21 PM
One-Way AOV for hatbong by ct
Source DF SS MS F P
ct 5 169.618 33.9237 5.96 0.0054
Error 12 68.287 5.6906
Total 17 237.905
Grand Mean 83.850 CV 2.84
Homogeneity of Variances F P
Levene's Test 1.12 0.4005
O'Brien's Test 0.50 0.7723
Brown and Forsythe Test 0.49 0.7810
Welch's Test for Mean Differences Source DF F P
ct 5.0 5.64 0.0414
Error 4.9
Component of variance for between groups 9.41104 Effective cell size 3.0
ct Mean
1 84.433
2 87.500
3 78.667
4 85.400
5 81.433
6 86.667
Observations per Mean 3
Standard Error of a Mean 1.3773 Std Error (Diff of 2 Means) 1.9477
Statistix - 30 Day Trial Version 9.0 7/22/2013, 5:38:36 PM
LSD All-Pairwise Comparisons Test of hatbong by ct ct Mean Homogeneous Groups
2 87.500 A
6 86.667 A
4 85.400 AB
1 84.433 AB
5 81.433 BC
3 78.667 C
1.9477 | ||
Critical T Value 2.179 | Critical Value for Comparison | 4.2438 |
There are 3 groups (A, B, | etc.) in which the means |