a. Rotation converged in 5 iterations.
Kaiser-Meyer-Olkin Measure of Sampling Adequacy. | .820 | |
Approx. Chi-Square | 989.671 | |
Bartlett's Test of Sphericity | df | 10 |
Sig. | .000 | |
Có thể bạn quan tâm!
-

 Những Hạn Chế Và Hướng Nghiên Cứu Tiếp Theo
 -
 Xin Cho Biết Mức Độ Lựa Chọn Của Quý Khách Đối Với Điểm Đến Du Lịch Bình Thuận.
 -
 Nghiên cứu các yếu tố ảnh hưởng đến việc lựa chọn điểm đến du lịch Bình Thuận của du khách trong nước - 15
 -
 Nghiên cứu các yếu tố ảnh hưởng đến việc lựa chọn điểm đến du lịch Bình Thuận của du khách trong nước - 17
 -
 Nghiên cứu các yếu tố ảnh hưởng đến việc lựa chọn điểm đến du lịch Bình Thuận của du khách trong nước - 18
 -
 Nghiên cứu các yếu tố ảnh hưởng đến việc lựa chọn điểm đến du lịch Bình Thuận của du khách trong nước - 19
Xem toàn bộ 173 trang tài liệu này.
Total Variance Explained
Initial Eigenvalues | Extraction Sums of Squared Loadings | |||||
Total | % of Variance | Cumulative % | Total | % of Variance | Cumulative % | |
1 | 3.593 | 71.857 | 71.857 | 3.593 | 71.857 | 71.857 |
2 | .604 | 12.087 | 83.944 | |||
3 | .381 | 7.623 | 91.567 | |||
4 | .243 | 4.865 | 96.432 | |||
5 | .178 | 3.568 | 100.000 |
Extraction Method: Principal Component Analysis.
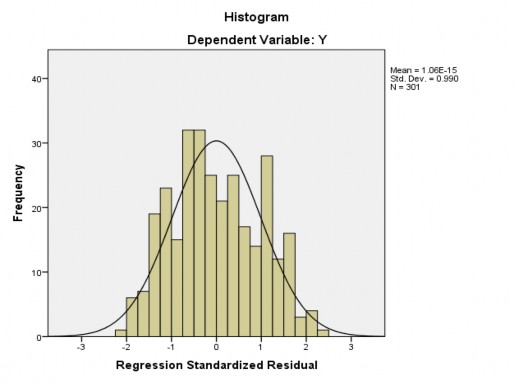
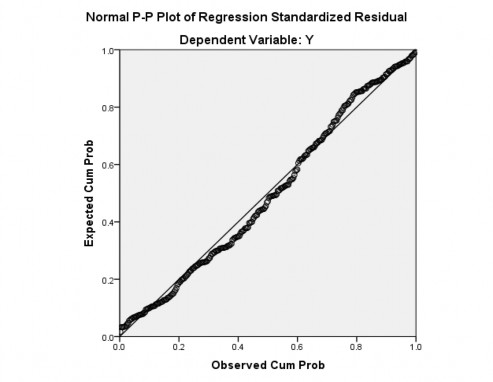
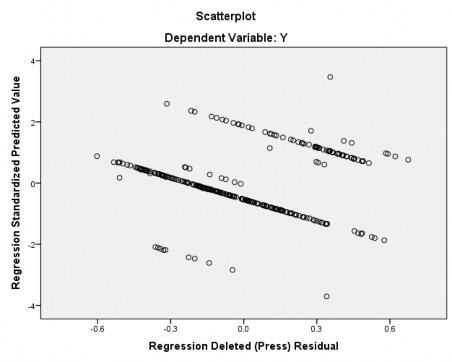
Regression
Descriptive Statistics
Mean | Std. Deviation | N | |
Y | 3.2226 | .49695 | 301 |
NL | 3.3821 | 1.07539 | 301 |
GC | 3.1003 | .59186 | 301 |
SP | 3.2007 | .59722 | 301 |
AT | 3.1814 | .67126 | 301 |
MT | 3.4360 | .62305 | 301 |
CSHT | 3.1321 | .65495 | 301 |
Correlations
Y | STI | NC | PCPV | CP | SHH | AT | ||
Pearson Correlation | Y | 1.000 | .358 | .554 | .578 | .231 | .505 | .500 |
NL | .358 | 1.000 | -.084 | .037 | .061 | .019 | -.062 | |
GC | .554 | -.084 | 1.000 | .477 | .002 | .464 | .378 | |
SP | .578 | .037 | .477 | 1.000 | -.083 | .559 | .442 | |
AT | .231 | .061 | .002 | -.083 | 1.000 | -.052 | -.039 | |
MT | .505 | .019 | .464 | .559 | -.052 | 1.000 | .393 | |
CSHT | .500 | -.062 | .378 | .442 | -.039 | .393 | 1.000 | |
Sig. (1-tailed) | Y | . | .000 | .000 | .000 | .000 | .000 | .000 |
NL | .000 | . | .072 | .261 | .147 | .374 | .143 | |
GC | .000 | .072 | . | .000 | .484 | .000 | .000 | |
SP | .000 | .261 | .000 | . | .075 | .000 | .000 | |
AT | .000 | .147 | .484 | .075 | . | .183 | .249 | |
MT | .000 | .374 | .000 | .000 | .183 | . | .000 | |
CSHT | .000 | .143 | .000 | .000 | .249 | .000 | . | |
N | Y | 301 | 301 | 301 | 301 | 301 | 301 | 301 |
NL | 301 | 301 | 301 | 301 | 301 | 301 | 301 | |
GC | 301 | 301 | 301 | 301 | 301 | 301 | 301 | |
SP | 301 | 301 | 301 | 301 | 301 | 301 | 301 | |
AT | 301 | 301 | 301 | 301 | 301 | 301 | 301 | |
MT | 301 | 301 | 301 | 301 | 301 | 301 | 301 | |
CSHT | 301 | 301 | 301 | 301 | 301 | 301 | 301 |
Variables Entered/Removeda
Variables Entered | Variables Removed | Method | |
1 | CSHT, AT, NL, GC, MT, SPb | . | Enter |
a. Dependent Variable: Y
b. All requested variables entered.
Model Summaryb
R | R Square | Adjusted R Square | Std. Error of the Estimate | Change Statistics | Durbin- Watson | |||||
R Square Change | F Change | df1 | df2 | Sig. F Change | ||||||
1 | .836a | .699 | .693 | .27532 | .699 | 113.90 1 | 6 | 294 | .000 | 2.085 |
a. Predictors: (Constant), CSHT, AT, NL, GC, MT, SP
b. Dependent Variable: Y
ANOVAa
Sum of Squares | df | Mean Square | F | Sig. | ||
Regression | 51.801 | 6 | 8.634 | 113.901 | .000b | |
1 | Residual | 22.285 | 294 | .076 | ||
Total | 74.086 | 300 |
a. Dependent Variable: Y
b. Predictors: (Constant), CSHT, AT, NL, GC, MT, SP
Coefficientsa
Unstandardized Coefficients | Standardized Coefficients | t | Sig. | Collinearity Statistics | ||||
B | Std. Error | Beta | Tolerance | VIF | ||||
1 | (Constant) | -.369 | .145 | -2.550 | .011 | |||
NL | .172 | .015 | .373 | 11.511 | .000 | .975 | 1.026 | |
GC | .260 | .032 | .310 | 8.020 | .000 | .685 | 1.459 | |
SP | .211 | .035 | .254 | 6.066 | .000 | .584 | 1.712 | |
AT | .182 | .024 | .245 | 7.614 | .000 | .985 | 1.015 | |
MT | .100 | .032 | .126 | 3.096 | .002 | .622 | 1.608 | |
CSHT | .193 | .028 | .254 | 6.873 | .000 | .748 | 1.337 |
a. Dependent Variable: Y
Residuals Statisticsa
Minimum | Maximum | Mean | Std. Deviation | N | |
Predicted Value | 1.6821 | 4.6628 | 3.2226 | .41554 | 301 |
Std. Predicted Value | -3.707 | 3.466 | .000 | 1.000 | 301 |
Standard Error of Predicted Value | .022 | .088 | .040 | .012 | 301 |
Adjusted Predicted Value | 1.6595 | 4.6452 | 3.2226 | .41600 | 301 |
Residual | -.58687 | .66107 | .00000 | .27255 | 301 |
Std. Residual | -2.132 | 2.401 | .000 | .990 | 301 |
Stud. Residual | -2.160 | 2.427 | .000 | 1.001 | 301 |
Deleted Residual | -.60244 | .67514 | -.00001 | .27875 | 301 |
Stud. Deleted Residual | -2.173 | 2.447 | .000 | 1.003 | 301 |
Mahal. Distance | .923 | 29.964 | 5.980 | 4.320 | 301 |
Cook's Distance | .000 | .027 | .003 | .004 | 301 |
Centered Leverage Value | .003 | .100 | .020 | .014 | 301 |
a. Dependent Variable: Y
T-Test
One-Sample Statistics
N | Mean | Std. Deviation | Std. Error Mean | |
NHANLUC1 | 301 | 3.3821 | 1.25308 | .07223 |
NHANLUC2 | 301 | 3.4518 | 1.26036 | .07265 |
NHANLUC3 | 301 | 3.3588 | 1.24264 | .07162 |
NHANLUC5 | 301 | 3.3355 | 1.25845 | .07254 |
NL | 301 | 3.3821 | 1.07539 | .06198 |
One-Sample Test
Test Value = 0 | ||||||
t | df | Sig. (2-tailed) | Mean Difference | 95% Confidence Interval of the Difference | ||
Lower | Upper | |||||
NHANLUC1 | 46.826 | 300 | .000 | 3.38206 | 3.2399 | 3.5242 |
NHANLUC2 | 47.516 | 300 | .000 | 3.45183 | 3.3089 | 3.5948 |
NHANLUC3 | 46.894 | 300 | .000 | 3.35880 | 3.2179 | 3.4998 |
NHANLUC5 | 45.985 | 300 | .000 | 3.33555 | 3.1928 | 3.4783 |
NL | 54.563 | 300 | .000 | 3.38206 | 3.2601 | 3.5040 |
T-Test
One-Sample Statistics
N | Mean | Std. Deviation | Std. Error Mean | |
GIACA1 | 301 | 3.2724 | .79511 | .04583 |
GIACA2 | 301 | 2.9668 | .89381 | .05152 |
GIACA3 | 301 | 2.9601 | .82365 | .04747 |
GIACA4 | 301 | 3.2060 | .79421 | .04578 |
GIACA5 | 301 | 3.0963 | .81692 | .04709 |
GC | 301 | 3.1003 | .59186 | .03411 |
One-Sample Test
Test Value = 0 | ||||||
t | df | Sig. (2-tailed) | Mean Difference | 95% Confidence Interval of the Difference | ||
Lower | Upper | |||||
GIACA1 | 71.404 | 300 | .000 | 3.27243 | 3.1822 | 3.3626 |
GIACA2 | 57.587 | 300 | .000 | 2.96678 | 2.8654 | 3.0682 |
GIACA3 | 62.352 | 300 | .000 | 2.96013 | 2.8667 | 3.0536 |
GIACA4 | 70.034 | 300 | .000 | 3.20598 | 3.1159 | 3.2961 |
GIACA5 | 65.759 | 300 | .000 | 3.09635 | 3.0037 | 3.1890 |
GC | 90.881 | 300 | .000 | 3.10033 | 3.0332 | 3.1675 |
T-Test
One-Sample Statistics
N | Mean | Std. Deviation | Std. Error Mean | |
SANPHAM1 | 301 | 3.1495 | .71711 | .04133 |
SANPHAM2 | 301 | 3.3322 | .75890 | .04374 |
SANPHAM3 | 301 | 3.1528 | .76805 | .04427 |
SANPHAM4 | 301 | 3.2658 | .76754 | .04424 |
SANPHAM5 | 301 | 3.1030 | .81201 | .04680 |
SP | 301 | 3.2007 | .59722 | .03442 |
One-Sample Test
Test Value = 0 | |||||
t | df | Sig. (2-tailed) | Mean Difference | 95% Confidence Interval of the Difference | |
Lower | Upper | ||||
76.198 | 300 | .000 | 3.14950 | 3.0682 | 3.2308 | |
SANPHAM2 | 76.179 | 300 | .000 | 3.33223 | 3.2461 | 3.4183 |
SANPHAM3 | 71.219 | 300 | .000 | 3.15282 | 3.0657 | 3.2399 |
SANPHAM4 | 73.819 | 300 | .000 | 3.26578 | 3.1787 | 3.3528 |
SANPHAM5 | 66.298 | 300 | .000 | 3.10299 | 3.0109 | 3.1951 |
SP | 92.981 | 300 | .000 | 3.20066 | 3.1329 | 3.2684 |
T-Test
One-Sample Statistics
N | Mean | Std. Deviation | Std. Error Mean | |
ANTOAN1 | 301 | 3.1694 | .78392 | .04518 |
ANTOAN2 | 301 | 3.3355 | .81876 | .04719 |
ANTOAN3 | 301 | 3.2425 | .88562 | .05105 |
ANTOAN4 | 301 | 3.0664 | 1.00776 | .05809 |
ANTOAN5 | 301 | 3.0930 | .92627 | .05339 |
AT | 301 | 3.1814 | .67126 | .03869 |
One-Sample Test
Test Value = 0 | ||||||
t | df | Sig. (2-tailed) | Mean Difference | 95% Confidence Interval of the Difference | ||
Lower | Upper | |||||
ANTOAN1 | 70.145 | 300 | .000 | 3.16944 | 3.0805 | 3.2584 |
ANTOAN2 | 70.680 | 300 | .000 | 3.33555 | 3.2427 | 3.4284 |
ANTOAN3 | 63.521 | 300 | .000 | 3.24252 | 3.1421 | 3.3430 |
ANTOAN4 | 52.791 | 300 | .000 | 3.06645 | 2.9521 | 3.1808 |
ANTOAN5 | 57.933 | 300 | .000 | 3.09302 | 2.9880 | 3.1981 |
AT | 82.227 | 300 | .000 | 3.18140 | 3.1053 | 3.2575 |
T-Test
One-Sample Statistics
N | Mean | Std. Deviation | Std. Error Mean | |
MOITRUONG1 | 301 | 3.5449 | .77167 | .04448 |
MOITRUONG2 | 301 | 3.3522 | .73183 | .04218 |
MOITRUONG4 | 301 | 3.4718 | .80625 | .04647 |
MOITRUONG5 | 301 | 3.3754 | .72704 | .04191 |
MT | 301 | 3.4360 | .62305 | .03591 |
One-Sample Test
Test Value = 0 | ||||||
t | df | Sig. (2-tailed) | Mean Difference | 95% Confidence Interval of the Difference | ||
Lower | Upper | |||||
MOITRUONG1 | 79.698 | 300 | .000 | 3.54485 | 3.4573 | 3.6324 |
MOITRUONG2 | 79.469 | 300 | .000 | 3.35216 | 3.2691 | 3.4352 |
MOITRUONG4 | 74.708 | 300 | .000 | 3.47176 | 3.3803 | 3.5632 |
MOITRUONG5 | 80.547 | 300 | .000 | 3.37542 | 3.2929 | 3.4579 |
MT | 95.680 | 300 | .000 | 3.43605 | 3.3654 | 3.5067 |
T-Test
One-Sample Statistics
N | Mean | Std. Deviation | Std. Error Mean | |
HATANG1 | 301 | 2.9834 | .88866 | .05122 |
HATANG2 | 301 | 3.1894 | .82099 | .04732 |
HATANG3 | 301 | 3.2658 | .73652 | .04245 |
HATANG4 | 301 | 3.0897 | .78012 | .04497 |
CSHT | 301 | 3.1321 | .65495 | .03775 |
One-Sample Test
Test Value = 0 | ||||||
t | df | Sig. (2-tailed) | Mean Difference | 95% Confidence Interval of the Difference | ||
Lower | Upper | |||||
HATANG1 | 58.245 | 300 | .000 | 2.98339 | 2.8826 | 3.0842 |
HATANG2 | 67.399 | 300 | .000 | 3.18937 | 3.0962 | 3.2825 |
HATANG3 | 76.928 | 300 | .000 | 3.26578 | 3.1822 | 3.3493 |
HATANG4 | 68.713 | 300 | .000 | 3.08970 | 3.0012 | 3.1782 |
CSHT | 82.967 | 300 | .000 | 3.13206 | 3.0578 | 3.2063 |
T-Test
Group Statistics
N | Mean | Std. Deviation | Std. Error Mean | |
NAM | 148 | 3.2243 | .48650 | .03999 |
Y | ||||
NU | 153 | 3.2209 | .50844 | .04110 |
Independent Samples Test