.270 | 1.285 | 96.788 | |||||||
19 | .245 | 1.166 | 97.954 | ||||||
20 | .226 | 1.076 | 99.031 | ||||||
21 | .204 | .969 | 100.000 | ||||||
Extraction Method: Principal Component Analysis. | |||||||||
Có thể bạn quan tâm!
-
 Sơ Đồ Cơ Cấu Tổ Chức Tại Eximbank
 -
 Giải pháp nâng cao chất lượng dịch vụ internet banking tại Ngân hàng TMCP Xuất nhập khẩu Việt Nam - 11
 -
 Đánh Giá Độ Tin Cậy Của Thang Đo Bằng Cronbach Alpha
 -
 Giải pháp nâng cao chất lượng dịch vụ internet banking tại Ngân hàng TMCP Xuất nhập khẩu Việt Nam - 14
Xem toàn bộ 117 trang tài liệu này.
Component | |||||
1 | 2 | 3 | 4 | 5 | |
E1 | .056 | .241 | .101 | .749 | .128 |
E2 | .171 | .206 | .220 | .640 | .132 |
E3 | .164 | .122 | .182 | .809 | .006 |
E4 | .005 | -.042 | -.105 | .700 | .404 |
A1 | .166 | .838 | .128 | .058 | .160 |
A2 | .147 | .819 | .090 | .104 | .212 |
A3 | .186 | .660 | .137 | .199 | .156 |
A4 | .394 | .640 | .063 | .274 | .084 |
R1 | .171 | .287 | .640 | .306 | -.036 |
R2 | .120 | .030 | .603 | .203 | .097 |
R3 | .112 | .031 | .845 | -.077 | .102 |
R4 | .038 | .213 | .828 | .106 | .186 |
C1 | .166 | .297 | .252 | .098 | .737 |
C2 | .239 | .130 | .267 | .230 | .694 |
C3 | .254 | .216 | .024 | .215 | .760 |
S1 | .701 | .214 | .101 | .012 | .148 |
S2 | .619 | .283 | -.013 | .163 | .006 |
S3 | .599 | .463 | .263 | .119 | -.018 |
S4 | .549 | -.011 | .519 | -.027 | .262 |
S5 | .708 | .048 | .153 | .171 | .243 |
S6 | .661 | .130 | .100 | .062 | .183 |
Extraction Method: Principal Component Analysis. Rotation Method: Varimax with Kaiser Normalization. | |||||
a. Rotation converged in 6 iterations. | |||||
2. Phân tích nhân tố khám phá EFA cho thang đo chất lượng dịch vụ internet banking
Kaiser-Meyer-Olkin Measure of Sampling Adequacy. | .683 | |
Bartlett's Test of Sphericity | Approx. Chi-Square | 308.278 |
df | 3 | |
Sig. | .000 | |
Compon ent | Initial Eigenvalues | Extraction Sums of Squared Loadings | ||||
Total | % of Variance | Cumulative % | Total | % of Variance | Cumulative % | |
1 | 2.328 | 77.602 | 77.602 | 2.328 | 77.602 | 77.602 |
2 | .478 | 15.924 | 93.526 | |||
3 | .194 | 6.474 | 100.000 | |||
Extraction Method: Principal Component Analysis. | ||||||
Component | |
1 | |
Q1 | .902 |
Q2 | .924 |
Q3 | .813 |
Extraction Method: Principal Component Analysis. | |
a. 1 components extracted. | |
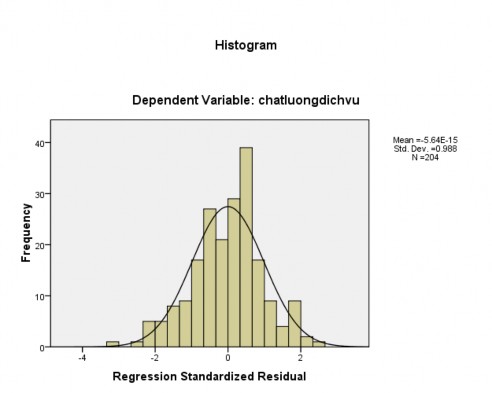
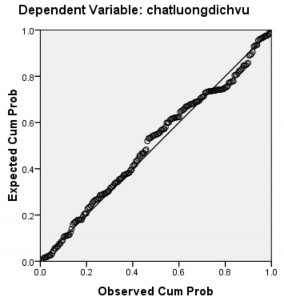
PHỤ LỤC 9: CÁC GIẢ ĐỊNH VÀ KIỂM ĐỊNH HỒI QUY TUYẾN TÍNH ĐA BỘI
Model | R | R Square | Adjusted R Square | Std. Error of the Estimate | Change Statistics | Durbin- Watson | ||||
R Square Change | F Change | df1 | df2 | Sig. F Change | ||||||
1 | .705a | .497 | .484 | .46296 | .497 | 39.155 | 5 | 198 | .000 | 1.994 |
a. Predictors: (Constant), chiphi, khanangdapung, desudung, sudambao, dichvukhachhang | ||||||||||
b. Dependent Variable: chatluongdichvu | ||||||||||
Model | Sum of Squares | df | Mean Square | F | Sig. | |
1 | Regression | 41.961 | 5 | 8.392 | 39.155 | .000a |
Residual | 42.438 | 198 | .214 | |||
Total | 84.398 | 203 | ||||
a. Predictors: (Constant), chiphi, khanangdapung, desudung, sudambao, dichvukhachhang | ||||||
b. Dependent Variable: chatluongdichvu | ||||||
Model | Unstandardized Coefficients | Standardized Coefficients | t | Sig. | 95% Confidence Interval for B | Collinearity Statistics | ||||
B | Std. Error | Beta | Lower Bound | Upper Bound | Tolerance | VIF | ||||
1 | (Constant) | -.362 | .302 | -1.201 | .231 | -.957 | .232 | |||
sudambao | .345 | .075 | .298 | 4.578 | .000 | .196 | .493 | .598 | 1.672 | |
khanangdapung | .303 | .065 | .273 | 4.640 | .000 | .174 | .431 | .735 | 1.360 | |
desudung | .234 | .066 | .209 | 3.514 | .001 | .102 | .365 | .714 | 1.400 | |
dichvukhachhan g | .184 | .080 | .155 | 2.295 | .023 | .026 | .343 | .559 | 1.788 | |
chiphi | .004 | .069 | .004 | .063 | .950 | -.132 | .141 | .574 | 1.743 | |
a. Dependent Variable: chatluongdichvu | ||||||||||
![]()
ankej paț»!paJø¡ paz!p•epue›s
O
O
ø’
Menp!sajg p az!r• epue›s
PHỤ LỤC 10:KIỂM ĐỊNH SỰ KHÁC BIỆT TRONG ĐÁNH GIÁ CÁC YẾU TỐ TẠO NÊN CHẤT LƯỢNG DỊCH VỤ INTERNET BANKING THEO CÁC BIẾN ĐỊNH TÍNH: GIỚI TÍNH, TUỔI, THU NHẬP
GIỚI TÍNH
Levene's Test for Equality of Variances | t-test for Equality of Means | ||||||||||
F | Sig. | t | df | Sig. (2- tailed) | Mean Differenc e | Std. Error Difference | 95% Confidence Interval of the Difference | ||||
Lower | Upper | ||||||||||
sudambao | Equal variances assumed | .181 | .671 | 1.460 | 202 | .146 | .11383 | .07797 | -.03990 | .26757 | |
Equal variances not assumed | 1.461 | 201.427 | .145 | .11383 | .07789 | -.03975 | .26741 | ||||
khanangda pung | Equal variances assumed | 1.567 | .212 | -.389 | 202 | .698 | -.03172 | .08162 | -.19266 | .12922 | |
Equal variances not assumed | -.386 | 189.506 | .700 | -.03172 | .08220 | -.19386 | .13042 | ||||
desudung | Equal variances assumed | .078 | .781 | .104 | 202 | .918 | .00842 | .08125 | -.15177 | .16862 | |
Equal variances not assumed | .103 | 193.618 | .918 | .00842 | .08166 | -.15264 | .16949 | ||||
dichvukhac hhang | Equal variances assumed | .133 | .716 | -.146 | 202 | .884 | -.01110 | .07603 | -.16103 | .13882 | |
Equal variances not assumed | -.146 | 197.541 | .884 | -.01110 | .07625 | -.16147 | .13927 | ||||
chiphi | Equal variances assumed | .083 | .773 | .636 | 202 | .525 | .05532 | .08694 | -.11611 | .22675 | |
Equal variances not assumed | .636 | 200.73 | .525 | .05532 | .08694 | -.11612 | .22676 | ||||
TUỔI
Levene Statistic | df1 | df2 | Sig. | |
sudambao | 2.122 | 3 | 200 | .099 |
khanangdapung | .428 | 3 | 200 | .733 |
desudung | 1.105 | 3 | 200 | .348 |
dichvukhachhang | .950 | 3 | 200 | .417 |
chiphi | .945 | 3 | 200 | .420 |
chatluongdichvu | 2.189 | 3 | 200 | .091 |
Sum of Squares | df | Mean Square | F | Sig. | ||
sudambao | Between Groups | .580 | 3 | .193 | .618 | .604 |
Within Groups | 62.607 | 200 | .313 | |||
Total | 63.187 | 203 | ||||
khanangdapung | Between Groups | .558 | 3 | .186 | .546 | .651 |
Within Groups | 68.019 | 200 | .340 | |||
Total | 68.577 | 203 | ||||
desudung | Between Groups | .391 | 3 | .130 | .386 | .763 |
Within Groups | 67.509 | 200 | .338 | |||
Total | 67.900 | 203 | ||||
dichvukhachhang | Between Groups | .523 | 3 | .174 | .592 | .621 |
Within Groups | 58.950 | 200 | .295 | |||
Total | 59.473 | 203 | ||||
chiphi | Between Groups | .286 | 3 | .095 | .245 | .865 |
Within Groups | 77.621 | 200 | .388 | |||
Total | 77.906 | 203 | ||||
chatluongdichvu | Between Groups | 1.640 | 3 | .547 | 1.321 | .269 |
Within Groups | 82.758 | 200 | .414 |
Sum of Squares | df | Mean Square | F | Sig. | ||
sudambao | Between Groups | .580 | 3 | .193 | .618 | .604 |
Within Groups | 62.607 | 200 | .313 | |||
Total | 63.187 | 203 | ||||
khanangdapung | Between Groups | .558 | 3 | .186 | .546 | .651 |
Within Groups | 68.019 | 200 | .340 | |||
Total | 68.577 | 203 | ||||
desudung | Between Groups | .391 | 3 | .130 | .386 | .763 |
Within Groups | 67.509 | 200 | .338 | |||
Total | 67.900 | 203 | ||||
dichvukhachhang | Between Groups | .523 | 3 | .174 | .592 | .621 |
Within Groups | 58.950 | 200 | .295 | |||
Total | 59.473 | 203 | ||||
chiphi | Between Groups | .286 | 3 | .095 | .245 | .865 |
Within Groups | 77.621 | 200 | .388 | |||
Total | 77.906 | 203 | ||||
chatluongdichvu | Between Groups | 1.640 | 3 | .547 | 1.321 | .269 |
Within Groups | 82.758 | 200 | .414 | |||
Total | 84.398 | 203 |
THU NHẬP
Levene Statistic | df1 | df2 | Sig. | |
sudambao | 1.315 | 3 | 200 | .271 |
khanangdapung | 1.249 | 3 | 200 | .293 |
desudung | .554 | 3 | 200 | .646 |
dichvukhachhang | .194 | 3 | 200 | .900 |
chiphi | .101 | 3 | 200 | .959 |
chatluongdichvu | 4.274 | 3 | 200 | .006 |