Anh/chị vui lòng cho biết những ý kiến đóng góp khác :
-----------------------------------------------------------------------------------------------------
-----------------------------------------------------------------------------------------------------
-----------------------------------------------------------------------------------------------------
-----------------------------------------------------------------------------------------------------
Một lần nữa tôi xin chân thành cảm ơn những câu trả lời và những ý kiến đóng góp quý báu của anh/chị!
Chúc anh/chị luôn khỏe mạnh và thành đạt trong cuộc sống!
PHỤ LỤC 6: THỐNG KÊ MẪU KHẢO SÁT
1. GIỚI TÍNH
Frequency | Percent | Valid Percent | Cumulative Percent | ||
Valid | 1 | 106 | 52.0 | 52.0 | 52.0 |
2 | 98 | 48.0 | 48.0 | 100.0 | |
Total | 204 | 100.0 | 100.0 |
Có thể bạn quan tâm!
-

 Giải Pháp Nâng Cao Chất Lượng Dịch Vụ Khách Hàng
 -
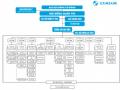 Sơ Đồ Cơ Cấu Tổ Chức Tại Eximbank
 -
 Giải pháp nâng cao chất lượng dịch vụ internet banking tại Ngân hàng TMCP Xuất nhập khẩu Việt Nam - 11
 -
 Giải pháp nâng cao chất lượng dịch vụ internet banking tại Ngân hàng TMCP Xuất nhập khẩu Việt Nam - 13
 -
 Giải pháp nâng cao chất lượng dịch vụ internet banking tại Ngân hàng TMCP Xuất nhập khẩu Việt Nam - 14
Xem toàn bộ 117 trang tài liệu này.

2. THU NHẬP
Frequency | Percent | Valid Percent | Cumulative Percent | ||
Valid | 1 | 6 | 2.9 | 2.9 | 2.9 |
2 | 58 | 28.4 | 28.4 | 31.4 | |
3 | 97 | 47.5 | 47.5 | 78.9 | |
4 | 43 | 21.1 | 21.1 | 100.0 | |
Total | 204 | 100.0 | 100.0 |
3. TUỔI
Frequency | Percent | Valid Percent | Cumulative Percent | ||
Valid | 1 | 75 | 36.8 | 36.8 | 36.8 |
2 | 72 | 35.3 | 35.3 | 72.1 | |
3 | 34 | 16.7 | 16.7 | 88.7 | |
4 | 23 | 11.3 | 11.3 | 100.0 | |
Total | 204 | 100.0 | 100.0 |
THỜI GIAN DÙNG
Frequency | Percent | Valid Percent | Cumulative Percent | ||
Valid | 1 | 31 | 15.2 | 15.2 | 15.2 |
2 | 74 | 36.3 | 36.3 | 51.5 |
3 | 99 | 48.5 | 48.5 | 100.0 |
Total | 204 | 100.0 | 100.0 |
5. TẦN SỐ SỬ DỤNG(SỐ LẦN TRÊN TUẦN)
Frequency | Percent | Valid Percent | Cumulative Percent | ||
Valid | 1 | 96 | 47.1 | 47.1 | 47.1 |
2 | 75 | 36.8 | 36.8 | 83.8 | |
3 | 33 | 16.2 | 16.2 | 100.0 | |
Total | 204 | 100.0 | 100.0 |
PHỤ LỤC 7: ĐÁNH GIÁ ĐỘ TIN CẬY CỦA THANG ĐO BẰNG CRONBACH ALPHA
1. Kết quả phân tích Cronbach alpha của các khái niệm trong thang đo chất lượng dịch vụ internet banking
Yếu tố dễ sử dụng
Cronbach's Alpha | Cronbach's Alpha Based on Standardized Items | N of Items |
.775 | .778 | 4 |
Mean | Std. Deviation | N | |
E1 | 3.85 | .770 | 204 |
E2 | 3.76 | .718 | 204 |
E3 | 3.79 | .700 | 204 |
E4 | 3.54 | .802 | 204 |
Scale Mean if Item Deleted | Scale Variance if Item Deleted | Corrected Item- Total Correlation | Squared Multiple Correlation | Cronbach's Alpha if Item Deleted | |
E1 | 11.10 | 3.104 | .610 | .373 | .703 |
E2 | 11.18 | 3.420 | .533 | .347 | .743 |
E3 | 11.15 | 3.194 | .667 | .452 | .677 |
E4 | 11.41 | 3.228 | .513 | .311 | .757 |
Yếu tố sự đảm bảo
Cronbach's Alpha | Cronbach's Alpha Based on Standardized Items | N of Items |
.842 | .841 | 4 |
Mean | Std. Deviation | N | |
A1 | 3.93 | .687 | 204 |
A2 | 3.95 | .679 | 204 |
A3 | 3.95 | .679 | 204 |
A4 | 4.00 | .666 | 204 |
Scale Mean if Item Deleted | Scale Variance if Item Deleted | Corrected Item- Total Correlation | Squared Multiple Correlation | Cronbach's Alpha if Item Deleted | |
A1 | 11.90 | 2.847 | .716 | .583 | .781 |
A2 | 11.88 | 2.857 | .725 | .582 | .777 |
A3 | 11.88 | 3.083 | .603 | .383 | .830 |
A4 | 11.83 | 3.010 | .661 | .445 | .805 |
Yếu tố khả năng đáp ứng
Cronbach's Alpha | Cronbach's Alpha Based on Standardized Items | N of Items |
.784 | .786 | 4 |
Mean | Std. Deviation | N | |
R1 | 3.89 | .708 | 204 |
R2 | 3.96 | .777 | 204 |
R3 | 3.90 | .778 | 204 |
R4 | 4.00 | .719 | 204 |
Scale Mean if Item Deleted | Scale Variance if Item Deleted | Corrected Item- Total Correlation | Squared Multiple Correlation | Cronbach's Alpha if Item Deleted | |
R1 | 11.85 | 3.529 | .518 | .302 | .766 |
R2 | 11.78 | 3.451 | .468 | .228 | .795 |
R3 | 11.84 | 3.029 | .654 | .519 | .697 |
R4 | 11.75 | 3.028 | .743 | .593 | .653 |
Yếu tố hiệu quả chi phí
Cronbach's Alpha | Cronbach's Alpha Based on Standardized Items | N of Items |
.804 | .805 | 3 |
Mean | Std. Deviation | N | |
C1 | 3.57 | .715 | 204 |
C2 | 3.56 | .744 | 204 |
C3 | 3.50 | .733 | 204 |
Scale Mean if Item Deleted | Scale Variance if Item Deleted | Corrected Item- Total Correlation | Squared Multiple Correlation | Cronbach's Alpha if Item Deleted | |
C1 | 7.06 | 1.715 | .655 | .433 | .729 |
C2 | 7.08 | 1.688 | .627 | .394 | .758 |
C3 | 7.13 | 1.652 | .671 | .453 | .711 |
Yếu tố dịch vụ khách hàng
Cronbach's Alpha | Cronbach's Alpha Based on Standardized Items | N of Items | |
.803 | .808 | 6 | |
Item Statistics | |||
Mean | Std. Deviation | N | |
S1 | 4.00 | .743 | 204 |
S2 | 3.95 | .734 | 204 |
S3 | 4.08 | .758 | 204 |
S4 | 3.71 | .788 | 204 |
S5 | 4.06 | .636 | 204 |
S6 | 3.79 | .892 | 204 |
Scale Mean if Item Deleted | Scale Variance if Item Deleted | Corrected Item- Total Correlation | Squared Multiple Correlation | Cronbach's Alpha if Item Deleted | |
S1 | 19.60 | 7.581 | .590 | .379 | .766 |
S2 | 19.65 | 7.924 | .504 | .283 | .785 |
S3 | 19.52 | 7.384 | .628 | .400 | .757 |
S4 | 19.89 | 7.628 | .528 | .326 | .780 |
S5 | 19.53 | 7.974 | .603 | .387 | .767 |
S6 | 19.80 | 7.183 | .538 | .314 | .782 |
Chất lượng dịch vụ internet banking
Cronbach's Alpha | Cronbach's Alpha Based on Standardized Items | N of Items |
.855 | .854 | 3 |
Mean | Std. Deviation | N | |
Q1 | 3.76 | .732 | 204 |
Q2 | 3.78 | .759 | 204 |
Q3 | 3.87 | .704 | 204 |
Scale Mean if Item Deleted | Scale Variance if Item Deleted | Corrected Item- Total Correlation | Squared Multiple Correlation | Cronbach's Alpha if Item Deleted | |
Q1 | 7.65 | 1.735 | .763 | .649 | .764 |
Q2 | 7.64 | 1.612 | .806 | .684 | .720 |
Q3 | 7.54 | 2.003 | .623 | .396 | .889 |
PHỤ LỤC 8: KẾT QUẢ PHÂN TÍCH NHÂN TỐ KHÁM PHÁ EFA
1. Phân tích nhân tố khám phá EFA cho các yếu tố tạo nên chất lượng dịch vụ internet banking
Kaiser-Meyer-Olkin Measure of Sampling Adequacy. | .868 | |
Bartlett's Test of Sphericity | Approx. Chi-Square | 1.954E3 |
df | 210 | |
Sig. | .000 | |
Compo nent | Initial Eigenvalues | Extraction Sums of Squared Loadings | Rotation Sums of Squared Loadings | ||||||
Total | % of Variance | Cumulative % | Total | % of Variance | Cumulative % | Total | % of Variance | Cumulative % | |
1 | 7.246 | 34.504 | 34.504 | 7.246 | 34.504 | 34.504 | 2.979 | 14.184 | 14.184 |
2 | 1.946 | 9.266 | 43.770 | 1.946 | 9.266 | 43.770 | 2.976 | 14.170 | 28.354 |
3 | 1.775 | 8.452 | 52.221 | 1.775 | 8.452 | 52.221 | 2.840 | 13.525 | 41.879 |
4 | 1.385 | 6.596 | 58.817 | 1.385 | 6.596 | 58.817 | 2.578 | 12.277 | 54.156 |
5 | 1.162 | 5.532 | 64.350 | 1.162 | 5.532 | 64.350 | 2.141 | 10.194 | 64.350 |
6 | .891 | 4.241 | 68.591 | ||||||
7 | .763 | 3.632 | 72.223 | ||||||
8 | .748 | 3.562 | 75.785 | ||||||
9 | .637 | 3.033 | 78.818 | ||||||
10 | .587 | 2.797 | 81.615 | ||||||
11 | .523 | 2.492 | 84.107 | ||||||
12 | .505 | 2.404 | 86.510 | ||||||
13 | .446 | 2.122 | 88.632 | ||||||
14 | .419 | 1.995 | 90.627 | ||||||
15 | .388 | 1.848 | 92.475 | ||||||
16 | .329 | 1.566 | 94.041 | ||||||
17 | .307 | 1.462 | 95.503 | ||||||