3.4. Tin tưởng và đồng cảm Reliability Statistics
N of Items | |
.757 | 4 |
Có thể bạn quan tâm!
-
 Mức Độ Đánh Giá Của Khách Hàng Về Thành Phần Của Chất Lượng Dịch Vụ Ngân Hàng Bán Lẻ
 -
 Thành Phần Chất Lượng Dịch Vụ Hành Vi:
 -
 Theo Quý Khách, Cn Agribank Hương Trà Cần Làm Gì Để Nâng Cao Sự Hài Lòng Của Khách Hàng Đối Với Dịch Vụ Ngân Hàng Bán Lẻ ?
 -
 Đánh giá chất lượng dịch vụ ngân hàng bán lẻ tại chi nhánh ngân hàng nông nghiệp và phát triển nông thôn thị xã hương trà - 10
Xem toàn bộ 89 trang tài liệu này.

Item-Total Statistics
Scale Mean if Item Deleted | Scale Variance if Item Deleted | Corrected Item-Total Correlation | Cronbach's Alpha if Item Deleted | |
moi giao dich duoc thuc hien chinh xac | 15.6000 | 6.304 | .549 | .706 |
co nhieu dich vu phu hop nhu cau | 16.2000 | 5.231 | .591 | .682 |
thay an toan khi su sung dich vu | 15.5077 | 6.252 | .573 | .695 |
duoc tu van nhung loi khuyen co loi | 16.1308 | 5.634 | .528 | .718 |
3.5. Tiếp cận thông tin Reliability Statistics
N of Items | |
.755 | 2 |
Item-Total Statistics
Scale Mean if Item Deleted | Scale Variance if Item Deleted | Corrected Item-Total Correlation | Cronbach's Alpha if Item Deleted | |
duoc cung cap day du thong tin truoc khi giao dich duoc tu van viec chon hinh thuc giao dich | 4.8231 4.8308 | .999 .948 | .606 .606 | .a .a |
a. The value is negative due to a negative average covariance among items. This violates reliability model assumptions. You may want to check item codings.
3.6. Thủ tục giao dịch Reliability Statistics
N of Items | |
.727 | 2 |
Item-Total Statistics
Scale Mean if Item Deleted | Scale Variance if Item Deleted | Corrected Item-Total Correlation | Cronbach's Alpha if Item Deleted | |
thu tuc giao dich don gian ro rang thoi gian giao dich nhanh chong | 5.0308 5.1538 | 1.363 1.309 | .571 .571 | .a |
.a |
a. The value is negative due to a negative average covariance among items. This violates reliability model assumptions. You may want to check item codings.
Cronbach's Alpha | N of Items |
.676 | 3 |
3.7. Hài lòng chung Reliability Statistics
Item-Total Statistics
Scale Mean if Item Deleted | Scale Variance if Item Deleted | Corrected Item-Total Correlation | Cronbach's Alpha if Item Deleted | |
hai long ve chat luong dich vu | 10.8308 | 2.405 | .428 | .658 |
cac dich vu dap ung duoc nhu cau cua toi | 11.0385 | 1.960 | .535 | .519 |
se tiep tuc su dung dich vu | 10.5923 | 2.398 | .514 | .556 |
4. Kiểm định phân phối chuẩn
One-Sample Kolmogorov-Smirnov Test
REGR factor score 1 for analysis 1 | REGR factor score 2 for analysis 1 | REGR factor score 3 for analysis 1 | REGR factor score 4 for analysis 1 | REGR factor score 5 for analysis 1 | REGR factor score 6 for analysis 1 | REGR factor score 1 for analysis 2 | |
N | 130 | 130 | 130 | 130 | 130 | 130 | 130 |
Normal Mean | .0000000 | .0000000 | .0000000 | .0000000 | .0000000 | .0000000 | .0000000 |
Parametersa Std. Deviation | 1.00000000 | 1.00000000 | 1.00000000 | 1.00000000 | 1.00000000 | 1.00000000 | 1.00000000 |
Most Absolute | .071 | .064 | .085 | .071 | .068 | .050 | .098 |
Extreme Positive | .031 | .064 | .041 | .038 | .068 | .041 | .075 |
Differences Negative | -.071 | -.048 | -.085 | -.071 | -.067 | -.050 | -.098 |
Kolmogorov-Smirnov Z | .809 | .728 | .965 | .807 | .774 | .570 | 1.112 |
Asymp. Sig. (2-tailed) | .529 | .665 | .310 | .533 | .587 | .901 | .168 |
a. Test distribution is Normal.
5. Kiểm định Independent Sample T test và One-way ANOVA
5.1. Giới tính
Independent Samples Test
Levene's Test Equality of Variances | for | t-test for Equality of Means | ||||||||
F | Sig. | t | df | Sig. (2- tailed) | Mean Difference | Std. Error Difference | 95% Confidence Interval of the Difference | |||
Lower | Upper | |||||||||
REGR factor score 1 for | Equal variances assumed | .042 | .838 | .920 | 128 | .359 | .16245374 | .17654261 | -.18686597 | .51177345 |
analysis 1 | Equal variances not assumed | .924 | 124.167 | .357 | .16245374 | .17572571 | -.18535204 | .51025952 | ||
REGR factor score 2 for | Equal variances assumed | .002 | .965 | -.726 | 128 | .469 | -.12838791 | .17676169 | -.47814112 | .22136530 |
analysis 1 | Equal variances not assumed | -.729 | 123.606 | .468 | -.12838791 | .17618880 | -.47712583 | .22035002 | ||
REGR factor score 3 for | Equal variances assumed | .248 | .619 | .562 | 128 | .575 | .09941389 | .17690749 | -.25062781 | .44945559 |
analysis 1 | Equal variances not assumed | .557 | 117.661 | .578 | .09941389 | .17843427 | -.25394509 | .45277288 | ||
REGR factor score 4 for | Equal variances assumed | .757 | .386 | .733 | 128 | .465 | .12964403 | .17675453 | -.22009500 | .47938307 |
analysis 1 | Equal variances not assumed | .726 | 117.053 | .469 | .12964403 | .17846581 | -.22379647 | .48308454 | ||
REGR factor score 5 for | Equal variances assumed | .268 | .605 | - 1.001 | 128 | .319 | -.17668896 | .17643575 | -.52579725 | .17241932 |
analysis 1 | Equal variances not assumed | -.996 | 119.265 | .321 | -.17668896 | .17745067 | -.52805099 | .17467306 | ||
REGR factor score 6 for | Equal variances assumed | 3.548 | .062 | -.520 | 128 | .604 | -.09201515 | .17693877 | -.44211873 | .25808842 |
analysis 1 | Equal variances not assumed | -.506 | 104.901 | .614 | -.09201515 | .18199239 | -.45287643 | .26884612 | ||
REGR factor score 1 for | Equal variances assumed | .225 | .636 | .253 | 128 | .801 | .04482262 | .17708127 | -.30556294 | .39520817 |
analysis 2 | Equal variances not assumed | .251 | 117.256 | .802 | .04482262 | .17873401 | -.30914266 | .39878789 | ||
5.2. Độ tuổi
Test of Homogeneity of Variances
Levene Statistic | df1 | df2 | Sig. | |
REGR factor score 1 for analysis 1 | .415 | 3 | 126 | .742 |
REGR factor score 2 for analysis 1 | .124 | 3 | 126 | .946 |
REGR factor score 3 for analysis 1 | 1.132 | 3 | 126 | .339 |
REGR factor score 4 for analysis 1 | .364 | 3 | 126 | .779 |
REGR factor score 5 for analysis 1 | 2.225 | 3 | 126 | .089 |
REGR factor score 6 for analysis 1 | .649 | 3 | 126 | .585 |
REGR factor score 1 for analysis 2 | 2.038 | 3 | 126 | .112 |
ANOVA
Sum of Squares | df | Mean Square | F | Sig. | |
REGR factor score 1 for analysis 1 Between Groups | .728 | 3 | .243 | .238 | .869 |
Within Groups | 128.272 | 126 | 1.018 | ||
Total | 129.000 | 129 | |||
REGR factor score 2 for analysis 1 Between Groups | 8.490 | 3 | 2.830 | 2.959 | .035 |
Within Groups | 120.510 | 126 | .956 | ||
Total | 129.000 | 129 | |||
REGR factor score 3 for analysis 1 Between Groups | .117 | 3 | .039 | .038 | .990 |
Within Groups | 128.883 | 126 | 1.023 | ||
Total | 129.000 | 129 | |||
REGR factor score 4 for analysis 1 Between Groups | 2.337 | 3 | .779 | .775 | .510 |
Within Groups | 126.663 | 126 | 1.005 | ||
Total | 129.000 | 129 | |||
REGR factor score 5 for analysis 1 Between Groups | 2.397 | 3 | .799 | .795 | .499 |
Within Groups | 126.603 | 126 | 1.005 | ||
Total | 129.000 | 129 | |||
REGR factor score 6 for analysis 1 Between Groups | 4.397 | 3 | 1.466 | 1.482 | .223 |
Within Groups | 124.603 | 126 | .989 | ||
Total | 129.000 | 129 | |||
REGR factor score 1 for analysis 2 Between Groups | 4.313 | 3 | 1.438 | 1.453 | .231 |
Within Groups | 124.687 | 126 | .990 | ||
Total | 129.000 | 129 |
5.3. Nghề nghiệp
Test of Homogeneity of Variances
Levene Statistic | df1 | df2 | Sig. | |
REGR factor score 1 for analysis 1 | 1.102 | 6 | 123 | .365 |
REGR factor score 2 for analysis 1 | .777 | 6 | 123 | .589 |
REGR factor score 3 for analysis 1 | 1.333 | 6 | 123 | .247 |
REGR factor score 4 for analysis 1 | 1.405 | 6 | 123 | .218 |
REGR factor score 5 for analysis 1 | 1.572 | 6 | 123 | .161 |
REGR factor score 6 for analysis 1 | .095 | 6 | 123 | .997 |
REGR factor score 1 for analysis 2 | .914 | 6 | 123 | .487 |
ANOVA
Sum of Squares | df | Mean Square | F | Sig. | |
REGR factor score 1 for analysis 1 Between Groups | 2.059 | 6 | .343 | .333 | .919 |
Within Groups | 126.941 | 123 | 1.032 | ||
Total | 129.000 | 129 | |||
REGR factor score 2 for analysis 1 Between Groups | 1.987 | 6 | .331 | .321 | .925 |
Within Groups | 127.013 | 123 | 1.033 | ||
Total | 129.000 | 129 | |||
REGR factor score 3 for analysis 1 Between Groups | 7.750 | 6 | 1.292 | 1.310 | .258 |
Within Groups | 121.250 | 123 | .986 | ||
Total | 129.000 | 129 | |||
REGR factor score 4 for analysis 1 Between Groups | 8.076 | 6 | 1.346 | 1.369 | .232 |
Within Groups | 120.924 | 123 | .983 | ||
Total | 129.000 | 129 | |||
REGR factor score 5 for analysis 1 Between Groups | 5.043 | 6 | .841 | .834 | .546 |
Within Groups | 123.957 | 123 | 1.008 | ||
Total | 129.000 | 129 | |||
REGR factor score 6 for analysis 1 Between Groups | 1.771 | 6 | .295 | .285 | .943 |
Within Groups | 127.229 | 123 | 1.034 | ||
Total | 129.000 | 129 | |||
REGR factor score 1 for analysis 2 Between Groups | 4.791 | 6 | .799 | .791 | .579 |
Within Groups | 124.209 | 123 | 1.010 | ||
Total | 129.000 | 129 |
5.4. Thu nhập
Test of Homogeneity of Variances
Levene Statistic | df1 | df2 | Sig. | |
REGR factor score 1 for analysis 1 | 1.826 | 4 | 125 | .128 |
REGR factor score 2 for analysis 1 | .763 | 4 | 125 | .551 |
REGR factor score 3 for analysis 1 | 1.228 | 4 | 125 | .302 |
REGR factor score 4 for analysis 1 | .503 | 4 | 125 | .734 |
REGR factor score 5 for analysis 1 | 1.361 | 4 | 125 | .251 |
REGR factor score 6 for analysis 1 | .187 | 4 | 125 | .945 |
REGR factor score 1 for analysis 2 | .699 | 4 | 125 | .594 |
ANOVA
Sum of Squares | df | Mean Square | F | Sig. | |
REGR factor score 1 for analysis 1 Between Groups | 10.826 | 4 | 2.706 | 2.863 | .026 |
Within Groups | 118.174 | 125 | .945 | ||
Total | 129.000 | 129 | |||
REGR factor score 2 for analysis 1 Between Groups | 8.349 | 4 | 2.087 | 2.162 | .077 |
Within Groups | 120.651 | 125 | .965 | ||
Total | 129.000 | 129 | |||
REGR factor score 3 for analysis 1 Between Groups | 6.810 | 4 | 1.703 | 1.742 | .145 |
Within Groups | 122.190 | 125 | .978 | ||
Total | 129.000 | 129 | |||
REGR factor score 4 for analysis 1 Between Groups | 2.066 | 4 | .516 | .509 | .730 |
Within Groups | 126.934 | 125 | 1.015 | ||
Total | 129.000 | 129 | |||
REGR factor score 5 for analysis 1 Between Groups | 4.505 | 4 | 1.126 | 1.131 | .345 |
Within Groups | 124.495 | 125 | .996 | ||
Total | 129.000 | 129 | |||
REGR factor score 6 for analysis 1 Between Groups | 5.838 | 4 | 1.460 | 1.481 | .212 |
Within Groups | 123.162 | 125 | .985 | ||
Total | 129.000 | 129 | |||
REGR factor score 1 for analysis 2 Between Groups | 3.328 | 4 | .832 | .827 | .510 |
Within Groups | 125.672 | 125 | 1.005 | ||
Total | 129.000 | 129 |
5.5. Trình độ học vấn
Test of Homogeneity of Variances
Levene Statistic | df1 | df2 | Sig. | |
REGR factor score 1 for analysis 1 | 1.583 | 3 | 126 | .197 |
REGR factor score 2 for analysis 1 | .561 | 3 | 126 | .642 |
REGR factor score 3 for analysis 1 | .950 | 3 | 126 | .419 |
REGR factor score 4 for analysis 1 | 1.740 | 3 | 126 | .162 |
REGR factor score 5 for analysis 1 | .483 | 3 | 126 | .695 |
REGR factor score 6 for analysis 1 | 1.197 | 3 | 126 | .314 |
REGR factor score 1 for analysis 2 | 2.415 | 3 | 126 | .070 |
ANOVA
Sum of Squares | df | Mean Square | F | Sig. | |
REGR factor score 1 for analysis 1 Between Groups | 4.386 | 3 | 1.462 | 1.478 | .224 |
Within Groups | 124.614 | 126 | .989 | ||
Total | 129.000 | 129 | |||
REGR factor score 2 for analysis 1 Between Groups | 3.751 | 3 | 1.250 | 1.258 | .292 |
Within Groups | 125.249 | 126 | .994 | ||
Total | 129.000 | 129 | |||
REGR factor score 3 for analysis 1 Between Groups | 5.118 | 3 | 1.706 | 1.735 | .163 |
Within Groups | 123.882 | 126 | .983 | ||
Total | 129.000 | 129 | |||
REGR factor score 4 for analysis 1 Between Groups | 8.318 | 3 | 2.773 | 2.895 | .038 |
Within Groups | 120.682 | 126 | .958 | ||
Total | 129.000 | 129 | |||
REGR factor score 5 for analysis 1 Between Groups | 1.656 | 3 | .552 | .546 | .652 |
Within Groups | 127.344 | 126 | 1.011 | ||
Total | 129.000 | 129 | |||
REGR factor score 6 for analysis 1 Between Groups | 1.383 | 3 | .461 | .455 | .714 |
Within Groups | 127.617 | 126 | 1.013 | ||
Total | 129.000 | 129 | |||
REGR factor score 1 for analysis 2 Between Groups | 3.038 | 3 | 1.013 | 1.013 | .389 |
Within Groups | 125.962 | 126 | 1.000 | ||
Total | 129.000 | 129 |
6. Hồi quy
6.1. Ma trận tương quan giữa cac thành phần chất lượng dịch vụ với sự hài lòng
Correlations
REGR factor score 1 for analysis 1 | REGR factor score 2 for analysis 1 | REGR factor score 3 for analysis 1 | REGR factor score 4 for analysis 1 | REGR factor score 5 for analysis 1 | REGR factor score 6 for analysis 1 | REGR factor score 1 for analysis 2 | ||
REGR factor score 1 for | Pearson Correlation | 1 | .000 | .000 | .000 | .000 | .000 | .335** |
analysis 1 | Sig. (2- tailed) | 1.000 | 1.000 | 1.000 | 1.000 | 1.000 | .000 | |
N | 130 | 130 | 130 | 130 | 130 | 130 | 130 | |
REGR factor score 2 for | Pearson Correlation | .000 | 1 | .000 | .000 | .000 | .000 | .404** |
analysis 1 | Sig. (2- tailed) | 1.000 | 1.000 | 1.000 | 1.000 | 1.000 | .000 | |
N | 130 | 130 | 130 | 130 | 130 | 130 | 130 | |
REGR factor score 3 for | Pearson Correlation | .000 | .000 | 1 | .000 | .000 | .000 | .107 |
analysis 1 | Sig. (2- tailed) | 1.000 | 1.000 | 1.000 | 1.000 | 1.000 | .225 | |
N | 130 | 130 | 130 | 130 | 130 | 130 | 130 | |
REGR factor score 4 for | Pearson Correlation | .000 | .000 | .000 | 1 | .000 | .000 | .309** |
analysis 1 | Sig. (2- tailed) | 1.000 | 1.000 | 1.000 | 1.000 | 1.000 | .000 | |
N | 130 | 130 | 130 | 130 | 130 | 130 | 130 | |
REGR factor score 5 for | Pearson Correlation | .000 | .000 | .000 | .000 | 1 | .000 | .191* |
analysis 1 | Sig. (2- tailed) | 1.000 | 1.000 | 1.000 | 1.000 | 1.000 | .030 | |
N | 130 | 130 | 130 | 130 | 130 | 130 | 130 | |
REGR factor score 6 for | Pearson Correlation | .000 | .000 | .000 | .000 | .000 | 1 | .230** |
analysis 1 | Sig. (2- tailed) | 1.000 | 1.000 | 1.000 | 1.000 | 1.000 | .009 | |
N | 130 | 130 | 130 | 130 | 130 | 130 | 130 | |
REGR factor score 1 for | Pearson Correlation | .335** | .404** | .107 | .309** | .191* | .230** | 1 |
analysis 2 | Sig. (2- tailed) | .000 | .000 | .225 | .000 | .030 | .009 | |
N | 130 | 130 | 130 | 130 | 130 | 130 | 130 |
**. Correlation is significant at the 0.01 level (2-tailed).
REGR factor score 1 for analysis 1 | REGR factor score 2 for analysis 1 | REGR factor score 3 for analysis 1 | REGR factor score 4 for analysis 1 | REGR factor score 5 for analysis 1 | REGR factor score 6 for analysis 1 | REGR factor score 1 for analysis 2 | ||
REGR factor score 1 for | Pearson Correlation | 1 | .000 | .000 | .000 | .000 | .000 | .335** |
analysis 1 | Sig. (2- tailed) | 1.000 | 1.000 | 1.000 | 1.000 | 1.000 | .000 | |
N | 130 | 130 | 130 | 130 | 130 | 130 | 130 | |
REGR factor score 2 for | Pearson Correlation | .000 | 1 | .000 | .000 | .000 | .000 | .404** |
analysis 1 | Sig. (2- tailed) | 1.000 | 1.000 | 1.000 | 1.000 | 1.000 | .000 | |
N | 130 | 130 | 130 | 130 | 130 | 130 | 130 | |
REGR factor score 3 for | Pearson Correlation | .000 | .000 | 1 | .000 | .000 | .000 | .107 |
analysis 1 | Sig. (2- tailed) | 1.000 | 1.000 | 1.000 | 1.000 | 1.000 | .225 | |
N | 130 | 130 | 130 | 130 | 130 | 130 | 130 | |
REGR factor score 4 for | Pearson Correlation | .000 | .000 | .000 | 1 | .000 | .000 | .309** |
analysis 1 | Sig. (2- tailed) | 1.000 | 1.000 | 1.000 | 1.000 | 1.000 | .000 | |
N | 130 | 130 | 130 | 130 | 130 | 130 | 130 | |
REGR factor score 5 for | Pearson Correlation | .000 | .000 | .000 | .000 | 1 | .000 | .191* |
analysis 1 | Sig. (2- tailed) | 1.000 | 1.000 | 1.000 | 1.000 | 1.000 | .030 | |
N | 130 | 130 | 130 | 130 | 130 | 130 | 130 | |
REGR factor score 6 for | Pearson Correlation | .000 | .000 | .000 | .000 | .000 | 1 | .230** |
analysis 1 | Sig. (2- tailed) | 1.000 | 1.000 | 1.000 | 1.000 | 1.000 | .009 | |
N | 130 | 130 | 130 | 130 | 130 | 130 | 130 | |
REGR factor score 1 for | Pearson Correlation | .335** | .404** | .107 | .309** | .191* | .230** | 1 |
analysis 2 | Sig. (2- tailed) | .000 | .000 | .225 | .000 | .030 | .009 | |
N | 130 | 130 | 130 | 130 | 130 | 130 | 130 |
*. Correlation is significant at the 0.05 level (2-tailed).
6.2. Kết quả hồi quy
Model Summaryf
R | R Square | Adjusted R Square | Std. Error of the Estimate | Durbin-Watson | |
1 | .404a | .163 | .157 | .91818372 | |
2 | .525b | .276 | .264 | .85762392 | |
3 | .610c | .372 | .357 | .80209846 | |
4 | .651d | .424 | .406 | .77078150 | |
5 | .679e | .461 | .439 | .74908706 | 1.872 |
a. Predictors: (Constant), REGR factor score 2 for analysis 1
b. Predictors: (Constant), REGR factor score 2 for analysis 1, REGR factor score 1 for analysis 1
c. Predictors: (Constant), REGR factor score 2 for analysis 1, REGR factor score 1 for analysis 1, REGR factor score 4 for analysis 1
d. Predictors: (Constant), REGR factor score 2 for analysis 1, REGR factor score 1 for analysis 1, REGR factor score 4 for analysis 1, REGR factor score 6 for analysis 1
e. Predictors: (Constant), REGR factor score 2 for analysis 1, REGR factor score 1 for analysis 1, REGR factor score 4 for analysis 1, REGR factor score 6 for analysis 1, REGR factor score 5 for analysis 1
f. Dependent Variable: REGR factor score 1 for analysis 2
ANOVAf
Sum of Squares | df | Mean Square | F | Sig. | ||
1 | Regression | 21.088 | 1 | 21.088 | 25.014 | .000a |
Residual | 107.912 | 128 | .843 | |||
Total | 129.000 | 129 | ||||
2 | Regression | 35.589 | 2 | 17.795 | 24.193 | .000b |
Residual | 93.411 | 127 | .736 | |||
Total | 129.000 | 129 | ||||
3 | Regression | 47.936 | 3 | 15.979 | 24.836 | .000c |
Residual | 81.064 | 126 | .643 | |||
Total | 129.000 | 129 | ||||
4 | Regression | 54.737 | 4 | 13.684 | 23.033 | .000d |
Residual | 74.263 | 125 | .594 | |||
Total | 129.000 | 129 | ||||
5 | Regression | 59.420 | 5 | 11.884 | 21.179 | .000e |
Residual | 69.580 | 124 | .561 | |||
Total | 129.000 | 129 |
a. Predictors: (Constant), REGR factor score 2 for analysis 1
b. Predictors: (Constant), REGR factor score 2 for analysis 1, REGR factor score 1 for analysis 1
c. Predictors: (Constant), REGR factor score 2 for analysis 1, REGR factor score 1 for analysis 1, REGR factor score 4 for analysis 1
d. Predictors: (Constant), REGR factor score 2 for analysis 1, REGR factor score 1 for analysis 1, REGR factor score 4 for analysis 1, REGR factor score 6 for analysis 1
e. Predictors: (Constant), REGR factor score 2 for analysis 1, REGR factor score 1 for analysis 1, REGR factor score 4 for analysis 1, REGR factor score 6 for analysis 1, REGR factor score 5 for analysis 1
f. Dependent Variable: REGR factor score 1 for analysis 2
Coefficientsa
Unstandardized | Coefficients | Standardized Coefficients | T | Sig. | Collinearity Statistics | ||
B | Std. Error | Beta | Tolerance | VIF | |||
1 (Constant) | -4.363E-16 | .081 | .000 | 1.000 | |||
REGR factor score 2 for analysis 1 | .404 | .081 | .404 | 5.001 | .000 | 1.000 | 1.000 |
2 (Constant) | -4.060E-16 | .075 | .000 | 1.000 | |||
REGR factor score 2 for analysis 1 | .404 | .076 | .404 | 5.355 | .000 | 1.000 | 1.000 |
REGR factor score 1 for analysis 1 | .335 | .076 | .335 | 4.440 | .000 | 1.000 | 1.000 |
3 (Constant) | -3.263E-16 | .070 | .000 | 1.000 | |||
REGR factor score 2 for analysis 1 | .404 | .071 | .404 | 5.725 | .000 | 1.000 | 1.000 |
REGR factor score 1 for analysis 1 | .335 | .071 | .335 | 4.748 | .000 | 1.000 | 1.000 |
REGR factor score 4 for analysis 1 | .309 | .071 | .309 | 4.381 | .000 | 1.000 | 1.000 |
4 (Constant) | -2.715E-16 | .068 | .000 | 1.000 | |||
REGR factor score 2 for analysis 1 | .404 | .068 | .404 | 5.958 | .000 | 1.000 | 1.000 |
REGR factor score 1 for analysis 1 | .335 | .068 | .335 | 4.940 | .000 | 1.000 | 1.000 |
REGR factor score 4 for analysis 1 | .309 | .068 | .309 | 4.559 | .000 | 1.000 | 1.000 |
REGR factor score 6 for analysis 1 | .230 | .068 | .230 | 3.383 | .001 | 1.000 | 1.000 |
5 (Constant) | -3.514E-16 | .066 | .000 | 1.000 | |||
REGR factor score 2 for analysis 1 | .404 | .066 | .404 | 6.130 | .000 | 1.000 | 1.000 |
REGR factor score 1 for analysis 1 | .335 | .066 | .335 | 5.084 | .000 | 1.000 | 1.000 |
REGR factor score 4 for analysis 1 | .309 | .066 | .309 | 4.691 | .000 | 1.000 | 1.000 |
REGR factor score 6 for analysis 1 | .230 | .066 | .230 | 3.481 | .001 | 1.000 | 1.000 |
REGR factor score 5 for analysis 1 | .191 | .066 | .191 | 2.889 | .005 | 1.000 | 1.000 |
a. Dependent Variable: REGR factor score 1 for analysis 2
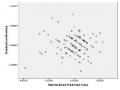
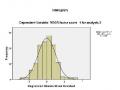
6.3. Kiểm định sai phạm