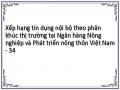
Classification Tablea
Predicted | ||||
V24_MH | Percentage Correct | |||
0 | 1 | |||
Step 1 | V24_M 0 | 17 | 21 | 44.7 |
H 1 | 4 | 153 | 97.5 | |
Overall Percentage | 87.2 | |||
Có thể bạn quan tâm!
-

 Xếp hạng tín dụng nội bộ theo phân khúc thị trường tại Ngân hàng Nông nghiệp và Phát triển nông thôn Việt Nam - 32
 -
 Xếp hạng tín dụng nội bộ theo phân khúc thị trường tại Ngân hàng Nông nghiệp và Phát triển nông thôn Việt Nam - 33
 -
 Xếp hạng tín dụng nội bộ theo phân khúc thị trường tại Ngân hàng Nông nghiệp và Phát triển nông thôn Việt Nam - 34
 -
 Xếp hạng tín dụng nội bộ theo phân khúc thị trường tại Ngân hàng Nông nghiệp và Phát triển nông thôn Việt Nam - 36
 -
 Xếp hạng tín dụng nội bộ theo phân khúc thị trường tại Ngân hàng Nông nghiệp và Phát triển nông thôn Việt Nam - 37
Xem toàn bộ 303 trang tài liệu này.

a. The cut value is .500
Variables in the Equation
B | S.E. | Wald | df | Sig. | Exp(B) | ||
Step 1a | Gioitinh | -.943 | .453 | 4.325 | 1 | .038 | .390 |
Nhomtuoi | .478 | .219 | 4.781 | 1 | .029 | 1.614 | |
v12 | .651 | .350 | 3.463 | 1 | .063 | 1.918 | |
v15 | -.297 | .168 | 3.119 | 1 | .077 | .743 | |
v16 | .772 | .206 | 14.018 | 1 | .000 | 2.164 | |
v21 | -.428 | .179 | 5.705 | 1 | .017 | .652 | |
Constant | -.917 | 1.327 | .477 | 1 | .490 | .400 |
a. Variable(s) entered on step 1: Gioitinh, Nhomtuoi, v12, v15, v16, v21.
Classification Tablea,b
Predicted | ||||
V24_MH | Percentage Correct | |||
0 | 1 | |||
Step 0 | V24_M 0 | 0 | 38 | .0 |
H 1 | 0 | 157 | 100.0 | |
Overall Percentage | 80.5 | |||
a. Constant is included in the model.
b. The cut value is .500
Variables in the Equation
B | S.E. | Wald | df | Sig. | Exp(B) | |
Step 0 Constant | 1.419 | .181 | 61.575 | 1 | .000 | 4.132 |
Variables not in the Equation
Score | df | Sig. | |
Step 0 Variables Gioitinh Nhomtuoi v12 v15 v16 v21 Overall Statistics | 4.034 7.976 3.822 2.981 29.054 15.614 47.161 | 1 1 1 1 1 1 6 | .045 .005 .051 .084 .000 .000 .000 |
Hàm hồi quy V25
Omnibus Tests of Model Coefficients
Chi-square | df | Sig. | ||
Step 1 | Step | 73.819 | 7 | .000 |
Block | 73.819 | 7 | .000 | |
Model | 73.819 | 7 | .000 |
Model Summary
-2 Log likelihood | Cox & Snell R Square | Nagelkerke R Square | |
1 | 115.662a | .315 | .507 |
a. Estimation terminated at iteration number 6 because parameter estimates changed by less than
.001.
Classification Tablea
Predicted | ||||
V25_MH | Percentage Correct | |||
0 | 1 | |||
Step 1 | V25_M 0 | 20 | 17 | 54.1 |
H 1 | 4 | 154 | 97.5 | |
Overall Percentage | 89.2 | |||
a. The cut value is .500
Variables in the Equation
B | S.E. | Wald | df | Sig. | Exp(B) | ||
Step 1a | v05 | -.859 | .209 | 16.921 | 1 | .000 | .424 |
v06 | 1.043 | .265 | 15.455 | 1 | .000 | 2.837 | |
v10 | -1.047 | .427 | 6.025 | 1 | .014 | .351 | |
v11 | .602 | .323 | 3.469 | 1 | .063 | 1.825 | |
v13 | .975 | .467 | 4.361 | 1 | .037 | 2.650 | |
v21 | -.503 | .204 | 6.070 | 1 | .014 | .605 | |
v22 | -.734 | .387 | 3.607 | 1 | .058 | .480 | |
Constant | 3.848 | 1.404 | 7.511 | 1 | .006 | 46.914 |
a. Variable(s) entered on step 1: v05, v06, v10, v11, v13, v21, v22.
Classification Tablea,b
Predicted | ||||
V25_MH | Percentage Correct | |||
0 | 1 | |||
Step 0 | V25_M 0 | 0 | 37 | .0 |
H 1 | 0 | 158 | 100.0 | |
Overall Percentage | 81.0 | |||
a. Constant is included in the model.
b. The cut value is .500
Variables in the Equation
B | S.E. | Wald | df | Sig. | Exp(B) | |
Step 0 Constant | 1.452 | .183 | 63.178 | 1 | .000 | 4.270 |
Variables not in the Equation
Score | df | Sig. | ||
Step 0 | Variables v05 v06 v10 v11 v13 v21 v22 Overall Statistics | 20.232 | 1 | .000 |
13.520 | 1 | .000 | ||
4.629 | 1 | .031 | ||
9.258 | 1 | .002 | ||
9.313 | 1 | .002 | ||
7.733 | 1 | .005 | ||
14.560 | 1 | .000 | ||
61.416 | 7 | .000 |
Hàm hồi quy V26
Omnibus Tests of Model Coefficients
Chi-square | df | Sig. | ||
Step 1 | Step | 94.858 | 6 | .000 |
Block | 94.858 | 6 | .000 | |
Model | 94.858 | 6 | .000 |
Model Summary
-2 Log likelihood | Cox & Snell R Square | Nagelkerke R Square | |
1 | 115.822a | .385 | .583 |
a. Estimation terminated at iteration number 6 because parameter estimates changed by less than
.001.
Classification Tablea
Predicted | ||||
V26.HC | Percentage Correct | |||
0 | 1 | |||
Step 1 | V26.HC 0 1 Overall Percentage | 31 | 14 | 68.9 |
7 | 143 | 95.3 | ||
89.2 | ||||
a. The cut value is .500
Variables in the Equation
B | S.E. | Wald | df | Sig. | Exp(B) | ||
Step 1a | V24_MH | .274 | .551 | .247 | 1 | .019 | 1.315 |
V25_MH | 2.647 | .662 | 15.975 | 1 | .000 | 14.114 | |
V27_MH | 2.882 | .626 | 21.204 | 1 | .000 | 17.855 | |
V28_MH | 1.278 | .547 | 5.464 | 1 | .019 | 3.589 | |
v29_MH | 3.279 | .601 | 29.767 | 1 | .000 | 26.546 | |
V30_MH | 1.890 | .539 | 12.315 | 1 | .000 | 6.619 | |
Constant | -7.505 | 1.307 | 32.989 | 1 | .000 | .001 |
a. Variable(s) entered on step 1: V24_MH, V25_MH, V27_MH, V28_MH, v29_MH, V30_MH.
Classification Tablea,b
Predicted | ||||
V26.HC | Percentage Correct | |||
0 | 1 | |||
Step 0 | V26.HC 0 1 Overall Percentage | 0 | 45 | .0 |
0 | 150 | 100.0 | ||
76.9 | ||||
a. Constant is included in the model.
b. The cut value is .500
Variables in the Equation
B | S.E. | Wald | df | Sig. | Exp(B) | |
Step 0 Constant | 1.204 | .170 | 50.177 | 1 | .000 | 3.333 |
Variables not in the Equation
Score | df | Sig. | ||
Step 0 | Variables V24_MH | 5.038 | 1 | .025 |
V25_MH | 24.685 | 1 | .000 | |
V27_MH | 13.454 | 1 | .000 | |
V28_MH | 13.564 | 1 | .000 | |
v29_MH | 31.698 | 1 | .000 | |
V30_MH | 7.122 | 1 | .008 | |
Overall Statistics | 84.088 | 6 | .000 |
Hàm hồi quy V27
Omnibus Tests of Model Coefficients
Chi-square | df | Sig. | ||
Step 1 | Step | 27.502 | 5 | .000 |
Block | 27.502 | 5 | .000 | |
Model | 27.502 | 5 | .000 |
Model Summary
-2 Log likelihood | Cox & Snell R Square | Nagelkerke R Square | |
1 | 61.979a | .132 | .212 |
a. Estimation terminated at iteration number 5 because parameter estimates changed by less than
.001.
Classification Tablea
Predicted | ||||
V27_MH | Percentage Correct | |||
0 | 1 | |||
Step 1 | V27_M 0 | 7 | 30 | 18.9 |
H 1 | 4 | 154 | 97.5 | |
Overall Percentage | 82.6 | |||
a. The cut value is .500
Variables in the Equation
B | S.E. | Wald | df | Sig. | Exp(B) | ||
Step 1a | Gioitinh | 1.004 | .415 | 5.868 | 1 | .015 | 2.730 |
Nhomtuoi | -.625 | .196 | 10.200 | 1 | .001 | .535 | |
v04 | -.439 | .420 | 1.092 | 1 | .096 | .644 | |
v16 | .533 | .190 | 7.822 | 1 | .005 | 1.703 | |
v17 | -.259 | .147 | 3.109 | 1 | .078 | .772 | |
Constant | 2.431 | .889 | 7.479 | 1 | .006 | 11.367 |
a. Variable(s) entered on step 1: Gioitinh, Nhomtuoi, v04, v16, v17.
Classification Tablea,b
Predicted | ||||
V27_MH | Percentage Correct | |||
0 | 1 | |||
Step 0 | V27_M 0 | 0 | 37 | .0 |
H 1 | 0 | 158 | 100.0 | |
Overall Percentage | 81.0 | |||
a. Constant is included in the model.
b. The cut value is .500
Variables in the Equation
B | S.E. | Wald | df | Sig. | Exp(B) | |
Step 0 Constant | 1.452 | .183 | 63.178 | 1 | .000 | 4.270 |
Variables not in the Equation
Score | df | Sig. | |
Step 0 Variables Gioitinh Nhomtuoi v04 v16 v17 Overall Statistics | 3.253 7.910 4.691 5.408 5.582 26.920 | 1 1 1 1 1 5 | .071 .005 .030 .020 .018 .000 |
Hàm hồi quy V28
Omnibus Tests of Model Coefficients
Chi-square | df | Sig. | ||
Step 1 | Step | 81.451 | 5 | .000 |
Block | 81.451 | 5 | .000 | |
Model | 81.451 | 5 | .000 |
Model Summary
-2 Log likelihood | Cox & Snell R Square | Nagelkerke R Square | |
1 | 40.564a | .341 | .502 |
a. Estimation terminated at iteration number 6 because parameter estimates changed by less than .001.
Classification Tablea
Predicted | ||||
V28_MH | Percentage Correct | |||
0 | 1 | |||
Step 1 | V28_M 0 | 35 | 15 | 70.0 |
H 1 | 9 | 136 | 93.8 | |
Overall Percentage | 87.7 | |||
a. The cut value is .500
Variables in the Equation
B | S.E. | Wald | df | Sig. | Exp(B) | ||
Step 1a | Gioitinh | -1.749 | .476 | 13.494 | 1 | .000 | .174 |
TTNT | -1.205 | .529 | 5.193 | 1 | .023 | .300 | |
v05 | -.945 | .204 | 21.455 | 1 | .000 | .389 | |
v06 | .688 | .209 | 10.796 | 1 | .001 | 1.990 | |
v10 | .595 | .329 | 3.265 | 1 | .071 | 1.813 | |
Constant | 1.750 | .998 | 3.075 | 1 | .079 | 5.755 |
a. Variable(s) entered on step 1: Gioitinh, TTNT, v05, v06, v10.
Classification Tablea,b
Predicted | ||||
V28_MH | Percentage Correct | |||
0 | 1 | |||
Step 0 | V28_M 0 | 0 | 50 | .0 |
H 1 | 0 | 145 | 100.0 | |
Overall Percentage | 74.4 | |||
a. Constant is included in the model.
b. The cut value is .500
Variables in the Equation
B | S.E. | Wald | df | Sig. | Exp(B) | |
Step 0 Constant | 1.065 | .164 | 42.147 | 1 | .000 | 2.900 |
Variables not in the Equation
Score | df | Sig. | |
Step 0 Variables Gioitinh TTNT v05 v06 v10 Overall Statistics | 18.507 11.894 29.349 24.845 8.195 67.598 | 1 1 1 1 1 5 | .000 .001 .000 .000 .004 .000 |