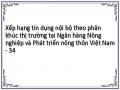
Variables in the Equation
B | S.E. | Wald | df | Sig. | Exp(B) | ||
Step 1a | TTNT | .935 | .430 | 4.731 | 1 | .030 | 2.547 |
v05.1 | .921 | .422 | 4.764 | 1 | .029 | 2.511 | |
v14 | .409 | .146 | 7.869 | 1 | .005 | 1.505 | |
v19 | -.343 | .182 | 3.553 | 1 | .059 | .709 | |
Constant | .777 | .851 | .835 | 1 | .361 | 2.175 |
Có thể bạn quan tâm!
-

 Xếp hạng tín dụng nội bộ theo phân khúc thị trường tại Ngân hàng Nông nghiệp và Phát triển nông thôn Việt Nam - 30
 -
 Xếp hạng tín dụng nội bộ theo phân khúc thị trường tại Ngân hàng Nông nghiệp và Phát triển nông thôn Việt Nam - 31
 -
 Xếp hạng tín dụng nội bộ theo phân khúc thị trường tại Ngân hàng Nông nghiệp và Phát triển nông thôn Việt Nam - 32
 -
 Xếp hạng tín dụng nội bộ theo phân khúc thị trường tại Ngân hàng Nông nghiệp và Phát triển nông thôn Việt Nam - 34
 -
 Xếp hạng tín dụng nội bộ theo phân khúc thị trường tại Ngân hàng Nông nghiệp và Phát triển nông thôn Việt Nam - 35
 -
 Xếp hạng tín dụng nội bộ theo phân khúc thị trường tại Ngân hàng Nông nghiệp và Phát triển nông thôn Việt Nam - 36
Xem toàn bộ 303 trang tài liệu này.

a. Variable(s) entered on step 1: TTNT, v05.1, v14, v19.
Classification Tablea,b
Predicted | ||||
V28_MH | Percentage Correct | |||
0 | 1 | |||
Step 0 | V28_M 0 | 0 | 37 | .0 |
H 1 | 0 | 142 | 100.0 | |
Overall Percentage | 79.3 | |||
a. Constant is included in the model.
b. The cut value is .500
Variables in the Equation
B | S.E. | Wald | df | Sig. | Exp(B) | |
Step 0 Constant | 1.345 | .185 | 53.091 | 1 | .000 | 3.838 |
Variables not in the Equation
Score | df | Sig. | ||
Step 0 | Variables TTNT v05.1 v14 v19 Overall Statistics | 1.027 | 1 | .311 |
5.539 | 1 | .019 | ||
5.138 | 1 | .023 | ||
1.593 | 1 | .207 | ||
17.414 | 4 | .002 |
Hàm hồi quy V29
Omnibus Tests of Model Coefficients
Chi-square | df | Sig. | ||
Step 1 | Step | 20.444 | 6 | .002 |
Block | 20.444 | 6 | .002 | |
Model | 20.444 | 6 | .002 |
Model Summary
-2 Log likelihood | Cox & Snell R Square | Nagelkerke R Square | |
1 | 53.595a | .108 | .174 |
a. Estimation terminated at iteration number 5 because parameter estimates changed by less than
.001.
Classification Tablea
Predicted | ||||
v29_MH | Percentage Correct | |||
0 | 1 | |||
Step 1 | v29_MH 0 1 Overall Percentage | 5 | 29 | 14.7 |
3 | 142 | 97.9 | ||
82.1 | ||||
a. The cut value is .500
Variables in the Equation
B | S.E. | Wald | df | Sig. | Exp(B) | ||
Step 1a | Nhomtuoi | -.274 | .256 | 1.145 | 1 | .085 | .760 |
v07 | -.595 | .424 | 1.971 | 1 | .060 | .551 | |
v08 | .985 | .503 | 3.830 | 1 | .050 | 2.679 | |
v12 | .780 | .316 | 6.076 | 1 | .014 | 2.181 | |
v16 | .269 | .227 | 1.398 | 1 | .037 | 1.308 | |
v18 | .516 | .293 | 3.099 | 1 | .078 | 1.676 | |
Constant | .914 | 1.928 | .225 | 1 | .635 | 2.495 |
a. Variable(s) entered on step 1: Nhomtuoi, v07, v08, v12, v16, v18.
Classification Tablea,b
Predicted | ||||
v29_MH | Percentage Correct | |||
0 | 1 | |||
Step 0 | v29_MH 0 1 Overall Percentage | 0 | 34 | .0 |
0 | 145 | 100.0 | ||
81.0 | ||||
a. Constant is included in the model.
b. The cut value is .500
Variables in the Equation
B | S.E. | Wald | df | Sig. | Exp(B) | |
Step 0 Constant | 1.450 | .191 | 57.937 | 1 | .000 | 4.265 |
Variables not in the Equation
Score | df | Sig. | |
Step 0 Variables Nhomtuoi v07 v08 v12 v16 v18 Overall Statistics | 3.179 3.029 6.841 3.122 6.622 3.070 19.193 | 1 1 1 1 1 1 6 | .075 .082 .009 .077 .010 .080 .004 |
Hàm hồi quy V30
Omnibus Tests of Model Coefficients
Chi-square | df | Sig. | ||
Step 1 | Step | 27.045 | 5 | .000 |
Block | 27.045 | 5 | .000 | |
Model | 27.045 | 5 | .000 |
Model Summary
-2 Log likelihood | Cox & Snell R Square | Nagelkerke R Square | |
1 | 52.652a | .140 | .221 |
a. Estimation terminated at iteration number 5 because parameter estimates changed by less than
.001.
Classification Tablea
Predicted | ||||
V30_MH | Percentage Correct | |||
0 | 1 | |||
Step 1 | V30_M 0 | 7 | 29 | 19.4 |
H 1 | 5 | 138 | 96.5 | |
Overall Percentage | 81.0 | |||
a. The cut value is .500
Variables in the Equation
B | S.E. | Wald | df | Sig. | Exp(B) | ||
Step 1a | Nhomtuoi | -.320 | .194 | 2.723 | 1 | .099 | .726 |
TTNT | 1.155 | .464 | 6.199 | 1 | .013 | 3.173 | |
v06 | -.159 | .179 | .782 | 1 | .077 | .853 | |
v11 | -.217 | .235 | .850 | 1 | .057 | .805 | |
v15 | .248 | .178 | 1.937 | 1 | .064 | 1.281 | |
Constant | 1.873 | .985 | 3.620 | 1 | .057 | 6.510 |
a. Variable(s) entered on step 1: Nhomtuoi, TTNT, v06, v11, v15.
Classification Tablea,b
Predicted | ||||
V30_MH | Percentage Correct | |||
0 | 1 | |||
Step 0 | V30_M 0 | 0 | 36 | .0 |
H 1 | 0 | 143 | 100.0 | |
Overall Percentage | 79.9 | |||
a. Constant is included in the model.
b. The cut value is .500
Variables in the Equation
B | S.E. | Wald | df | Sig. | Exp(B) | |
Step 0 Constant | 1.379 | .186 | 54.717 | 1 | .000 | 3.972 |
Variables not in the Equation
Score | df | Sig. | |
Step 0 Variables Nhomtuoi TTNT v06 v11 v15 Overall Statistics | 9.396 14.677 14.513 7.633 3.743 26.393 | 1 1 1 1 1 5 | .002 .000 .000 .006 .053 .000 |
VÙNG 5
Hàm hồi quy V24
Omnibus Tests of Model Coefficients
Chi-square | df | Sig. | ||
Step 1 | Step | 33.119 | 5 | .000 |
Block | 33.119 | 5 | .000 | |
Model | 33.119 | 5 | .000 |
Model Summary
-2 Log likelihood | Cox & Snell R Square | Nagelkerke R Square | |
1 | 36.275a | .228 | .344 |
a. Estimation terminated at iteration number 5 because parameter estimates changed by less than .001.
Classification Tablea
Predicted | ||||
V24_MH | Percentage Correct | |||
0 | 1 | |||
Step 1 | V24_M 0 | 13 | 17 | 43.3 |
H 1 | 9 | 89 | 90.8 | |
Overall Percentage | 79.7 | |||
a. The cut value is .500
Variables in the Equation
B | S.E. | Wald | df | Sig. | Exp(B) | ||
Step 1a | v08 | 2.176 | .642 | 11.474 | 1 | .001 | 8.809 |
v14 | -.192 | .237 | .658 | 1 | .017 | .825 | |
v18.1 | -1.633 | .564 | 8.369 | 1 | .004 | .195 | |
v20 | -.599 | .247 | 5.877 | 1 | .015 | .549 | |
v23 | .596 | .247 | 5.845 | 1 | .016 | 1.815 | |
Constant | .352 | 1.068 | .108 | 1 | .042 | 1.421 |
a. Variable(s) entered on step 1: v08, v14, v18.1, v20, v23.
Classification Tablea,b
Predicted | ||||
V24_MH | Percentage Correct | |||
0 | 1 | |||
Step 0 | V24_M 0 | 0 | 30 | .0 |
H 1 | 0 | 98 | 100.0 | |
Overall Percentage | 76.6 | |||
a. Constant is included in the model.
b. The cut value is .500
Variables in the Equation
B | S.E. | Wald | df | Sig. | Exp(B) | |
Step 0 Constant | 1.184 | .209 | 32.186 | 1 | .000 | 3.267 |
Variables not in the Equation
Score | df | Sig. | ||
Step 0 | Variables v08 v14 v18.1 v20 v23 Overall Statistics | 16.567 | 1 | .000 |
.664 | 1 | .015 | ||
10.923 | 1 | .001 | ||
4.217 | 1 | .040 | ||
1.066 | 1 | .002 | ||
33.285 | 5 | .000 |
Hàm hồi quy V25
Omnibus Tests of Model Coefficients
Chi-square | df | Sig. | ||
Step 1 | Step | 56.854 | 6 | .000 |
Block | 56.854 | 6 | .000 | |
Model | 56.854 | 6 | .000 |
Model Summary
-2 Log likelihood | Cox & Snell R Square | Nagelkerke R Square | |
1 | 77.628a | .359 | .552 |
a. Estimation terminated at iteration number 7 because parameter estimates changed by less than
.001.
Classification Tablea
Predicted | ||||
V25_MH | Percentage Correct | |||
0 | 1 | |||
Step 1 | V25_M 0 | 16 | 12 | 57.1 |
H 1 | 3 | 97 | 97.0 | |
Overall Percentage | 88.3 | |||
a. The cut value is .500
Variables in the Equation
B | S.E. | Wald | df | Sig. | Exp(B) | ||
Step 1a | v07 | -1.707 | .760 | 5.039 | 1 | .025 | .181 |
v09 | -1.747 | .736 | 5.632 | 1 | .018 | .174 | |
v11 | .911 | .354 | 6.612 | 1 | .010 | 2.488 | |
v15 | -.806 | .257 | 9.880 | 1 | .002 | .446 | |
v16 | 1.030 | .338 | 9.280 | 1 | .002 | 2.800 | |
v23 | -.532 | .262 | 4.117 | 1 | .042 | .587 | |
Constant | 9.204 | 3.604 | 6.522 | 1 | .011 | 9934.413 |
a. Variable(s) entered on step 1: v07, v09, v11, v15, v16, v23.
Classification Tablea,b
Predicted | ||||
V25_MH | Percentage Correct | |||
0 | 1 | |||
Step 0 | V25_M 0 | 0 | 28 | .0 |
H 1 | 0 | 100 | 100.0 | |
Overall Percentage | 78.1 | |||
a. Constant is included in the model.
b. The cut value is .500
Variables in the Equation
B | S.E. | Wald | df | Sig. | Exp(B) | |
Step 0 Constant | 1.273 | .214 | 35.447 | 1 | .000 | 3.571 |
Variables not in the Equation
Score | df | Sig. | ||
Step 0 | Variables v07 v09 v11 v15 v16 v23 Overall Statistics | 10.159 | 1 | .001 |
20.121 | 1 | .000 | ||
6.981 | 1 | .008 | ||
9.871 | 1 | .002 | ||
19.996 | 1 | .000 | ||
1.407 | 1 | .036 | ||
47.996 | 6 | .000 |
Hàm hồi quy V26
Omnibus Tests of Model Coefficients
Chi-square | df | Sig. | ||
Step 1 | Step | 73.447 | 6 | .000 |
Block | 73.447 | 6 | .000 | |
Model | 73.447 | 6 | .000 |
Model Summary
-2 Log likelihood | Cox & Snell R Square | Nagelkerke R Square | |
1 | 70.510a | .437 | .647 |
a. Estimation terminated at iteration number 7 because parameter estimates changed by less than .001.
Classification Tablea
Predicted | ||||
V26.HC | Percentage Correct | |||
0 | 1 | |||
Step 1 | V26.HC 0 1 Overall Percentage | 22 | 10 | 68.8 |
5 | 91 | 94.8 | ||
88.3 | ||||
a. The cut value is .500