PHỤ LỤC 5
KIỂM ĐỊNH MÔ HÌNH ĐÁNH GIÁ KẾT QUẢ PHÁT TRIỂN KINH DOANH THEO MÔ HÌNH KINH TẾ CHIA SẺ CỦA CÁC DOANH NGHIỆP TRONG LĨNH VỰC DỊCH VỤ DU LỊCH TRỰC TUYẾN TẠI VIỆT NAM BẰNG PHẦN MỀM SPSS 20 VÀ PHẦN MỀM AMOS 23
Descriptives
N | Minimum | Maximum | Mean | Std. Deviation | |
RES1 | 263 | 2 | 7 | 5.48 | 1.188 |
RES2 | 263 | 2 | 7 | 5.13 | 1.157 |
RES3 | 263 | 2 | 7 | 5.13 | 1.107 |
RES4 | 263 | 3 | 7 | 5.46 | 1.104 |
RES5 | 263 | 3 | 7 | 5.52 | 1.101 |
COMP1 | 263 | 1 | 7 | 5.30 | 1.127 |
STRAT1 | 263 | 1 | 5 | 3.25 | .979 |
SHAR1 | 263 | 1 | 5 | 1.90 | .952 |
SHAR2 | 263 | 1 | 6 | 2.21 | 1.243 |
SHAR3 | 263 | 1 | 5 | 1.92 | 1.049 |
COMP2 | 263 | 2 | 7 | 5.60 | 1.035 |
COMP3 | 263 | 2 | 7 | 5.70 | 1.017 |
STRAT2 | 263 | 1 | 7 | 4.89 | 1.454 |
STRAT3 | 263 | 2 | 7 | 5.19 | 1.236 |
PERF1 | 263 | 1 | 7 | 4.51 | 1.304 |
PERF2 | 263 | 2 | 7 | 4.96 | 1.105 |
PERF3 | 263 | 1 | 7 | 4.96 | 1.139 |
Valid N (listwise) | 263 |
Có thể bạn quan tâm!
-

 Phát triển kinh doanh theo mô hình kinh tế chia sẻ của các doanh nghiệp trong lĩnh vực dịch vụ du lịch trực tuyến tại Việt Nam - 26
 -
 Phát triển kinh doanh theo mô hình kinh tế chia sẻ của các doanh nghiệp trong lĩnh vực dịch vụ du lịch trực tuyến tại Việt Nam - 27
 -
 Phát triển kinh doanh theo mô hình kinh tế chia sẻ của các doanh nghiệp trong lĩnh vực dịch vụ du lịch trực tuyến tại Việt Nam - 28
 -
 Phát triển kinh doanh theo mô hình kinh tế chia sẻ của các doanh nghiệp trong lĩnh vực dịch vụ du lịch trực tuyến tại Việt Nam - 30
Xem toàn bộ 247 trang tài liệu này.
Scale: RES-Tieu chi ve nguon luc
Case Processing Summary
N | % | ||
Valid | 263 | 100.0 | |
Cases | Excludeda | 0 | .0 |
Total | 263 | 100.0 |
a. Listwise deletion based on all variables in the procedure.
Reliability Statistics
N of Items | |
.865 | 5 |
Item-Total Statistics
Scale Mean if Item Deleted | Scale Variance if Item Deleted | Corrected Item- Total Correlation | Cronbach's Alpha if Item Deleted | |
RES1 | 21.24 | 13.320 | .700 | .833 |
RES2 | 21.59 | 13.548 | .694 | .835 |
RES3 | 21.59 | 13.937 | .682 | .838 |
RES4 | 21.25 | 14.030 | .671 | .840 |
RES5 | 21.19 | 13.966 | .683 | .837 |
Scale Statistics
Variance | Std. Deviation | N of Items | |
26.72 | 20.798 | 4.561 | 5 |
Scale: STRAT-Dinh huong ve chien luoc
Case Processing Summary
N | % | ||
Cases | Valid | 263 | 100.0 |
Excludeda | 0 | .0 |
Total | 263 | 100.0 |
a. Listwise deletion based on all variables in the procedure.
Reliability Statistics
N of Items | |
.323 | 3 |
Item-Total Statistics
Scale Mean if Item Deleted | Scale Variance if Item Deleted | Corrected Item- Total Correlation | Cronbach's Alpha if Item Deleted | |
STRAT1 | 10.08 | 5.730 | -.176 | .729 |
STRAT2 | 8.44 | 2.033 | .414 | -.446a |
STRAT3 | 8.14 | 2.699 | .402 | -.276a |
a. The value is negative due to a negative average covariance among items. This violates reliability model assumptions. You may want to check item codings.
Scale Statistics
Variance | Std. Deviation | N of Items | |
13.33 | 5.862 | 2.421 | 3 |
Scale: STRAT-Dinh huong ve chien luoc-loai STRA1 Case Processing Summary
N | % | ||
Valid | 263 | 100.0 | |
Cases | Excludeda | 0 | .0 |
Total | 263 | 100.0 |
a. Listwise deletion based on all variables in the procedure.
Reliability Statistics
N of Items | |
.729 | 2 |
Item-Total Statistics
Scale Mean if Item Deleted | Scale Variance if Item Deleted | Corrected Item- Total Correlation | Cronbach's Alpha if Item Deleted | |
STRAT2 | 5.19 | 1.529 | .581 | . |
STRAT3 | 4.89 | 2.114 | .581 | . |
Scale Statistics
Variance | Std. Deviation | N of Items | |
10.08 | 5.730 | 2.394 | 2 |
Scale: SHAR-Kha nang chia se dich vu DLTT Case Processing Summary
N | % | ||
Valid | 263 | 100.0 | |
Cases | Excludeda | 0 | .0 |
Total | 263 | 100.0 |
a. Listwise deletion based on all variables in the procedure.
Reliability Statistics
N of Items | |
.765 | 3 |
Item-Total Statistics
Scale Mean if Item Deleted | Scale Variance if Item Deleted | Corrected Item- Total Correlation | Cronbach's Alpha if Item Deleted | |
SHAR1 | 4.13 | 4.212 | .546 | .743 |
SHAR2 | 3.83 | 3.099 | .595 | .705 |
SHAR3 | 4.11 | 3.492 | .678 | .596 |
Scale Statistics
Variance | Std. Deviation | N of Items | |
6.03 | 7.251 | 2.693 | 3 |
Scale: COMP-Tieu chi ve canh tranh
Case Processing Summary
N | % | ||
Valid | 263 | 100.0 | |
Cases | Excludeda | 0 | .0 |
Total | 263 | 100.0 |
a. Listwise deletion based on all variables in the procedure.
Reliability Statistics
N of Items | |
.804 | 3 |
Item-Total Statistics
Scale Mean if Item Deleted | Scale Variance if Item Deleted | Corrected Item- Total Correlation | Cronbach's Alpha if Item Deleted | |
COMP2 | 11.00 | 3.206 | .809 | .563 |
COMP3 | 10.90 | 3.357 | .775 | .604 |
COMP1 | 11.31 | 4.092 | .420 | .971 |
Scale Statistics
Variance | Std. Deviation | N of Items | |
16.60 | 7.278 | 2.698 | 3 |
Scale: PERF-Tieu chi ve ket qua
Case Processing Summary
N | % | ||
Valid | 263 | 100.0 | |
Cases | Excludeda | 0 | .0 |
Total | 263 | 100.0 |
a. Listwise deletion based on all variables in the procedure.
Reliability Statistics
N of Items | |
.784 | 3 |
Item-Total Statistics
Scale Mean if Item Deleted | Scale Variance if Item Deleted | Corrected Item- Total Correlation | Cronbach's Alpha if Item Deleted | |
PERF1 | 9.92 | 3.872 | .635 | .700 |
PERF2 | 9.48 | 4.853 | .567 | .765 |
PERF3 | 9.48 | 4.327 | .678 | .650 |
Scale Statistics
Variance | Std. Deviation | N of Items | |
14.44 | 8.835 | 2.972 | 3 |
Factor Analysis
KMO and Bartlett's Test
.799 | |
Approx. Chi-Square | 2302.639 |
Bartlett's Test of Sphericity df | 120 |
Sig. | .000 |
Communalities
Initial | Extraction | |
RES1 | .577 | .545 |
.608 | .595 | |
RES3 | .567 | .592 |
RES4 | .532 | .572 |
RES5 | .611 | .649 |
COMP1 | .582 | .606 |
SHAR1 | .413 | .436 |
SHAR2 | .409 | .517 |
SHAR3 | .486 | .689 |
COMP2 | .903 | .992 |
COMP3 | .894 | .898 |
STRAT2 | .469 | .989 |
STRAT3 | .422 | .391 |
PERF1 | .520 | .622 |
PERF2 | .471 | .513 |
PERF3 | .541 | .656 |
Extraction Method: Principal Axis Factoring.
Total Variance Explained
Initial Eigenvalues | Extraction Sums of Squared Loadings | Rotation Sums of Squared Loadingsa | |||||
Total | % of Variance | Cumulative % | Total | % of Variance | Cumulative % | Total | |
1 | 5.522 | 34.514 | 34.514 | 5.195 | 32.466 | 32.466 | 4.575 |
2 | 2.156 | 13.474 | 47.988 | 1.730 | 10.811 | 43.277 | 3.479 |
3 | 1.680 | 10.502 | 58.490 | 1.294 | 8.089 | 51.366 | 2.855 |
4 | 1.393 | 8.708 | 67.197 | 1.211 | 7.569 | 58.935 | 1.694 |
5 | 1.052 | 6.574 | 73.772 | .831 | 5.195 | 64.130 | 2.140 |
6 | .711 | 4.445 | 78.217 | ||||
7 | .623 | 3.896 | 82.113 | ||||
8 | .497 | 3.104 | 85.216 | ||||
9 | .428 | 2.673 | 87.890 | ||||
10 | .409 | 2.557 | 90.446 | ||||
11 | .371 | 2.322 | 92.768 | ||||
12 | .326 | 2.036 | 94.804 | ||||
13 | .302 | 1.885 | 96.689 | ||||
14 | .245 | 1.534 | 98.223 | ||||
15 | .232 | 1.448 | 99.671 | ||||
16 | .053 | .329 | 100.000 |
Extraction Method: Principal Axis Factoring.
a. When factors are correlated, sums of squared loadings cannot be added to obtain a total variance.
Factor Matrixa
Factor | |||||
1 | 2 | 3 | 4 | 5 | |
COMP2 | .767 | ||||
RES5 | .767 | ||||
RES2 | .737 |
.726 | .692 | ||
COMP1 | .720 | ||
RES1 | .701 | ||
RES4 | .652 | ||
RES3 | .642 | ||
PERF3 | .573 | .516 | |
PERF2 | |||
STRAT3 | |||
SHAR3 | .794 | ||
SHAR2 | .686 | ||
SHAR1 | .649 | ||
PERF1 | .591 | ||
STRAT2 |
Extraction Method: Principal Axis Factoring.
a. Attempted to extract 5 factors. More than 25 iterations required. (Convergence=.009). Extraction was terminated.
Pattern Matrixa
Factor | |||||
1 | 2 | 3 | 4 | 5 | |
RES3 | .848 | ||||
RES4 | .784 | ||||
COMP1 | .759 | ||||
RES5 | .725 | ||||
RES1 | .675 | ||||
RES2 | .600 | ||||
COMP2 | .986 | ||||
COMP3 | .937 | ||||
PERF1 | .815 | ||||
PERF3 | .748 | ||||
PERF2 | .690 | ||||
SHAR3 | .834 | ||||
SHAR2 | .720 | ||||
SHAR1 | .636 | ||||
STRAT2 | 1.019 | ||||
STRAT3 | .510 |
Extraction Method: Principal Axis Factoring.
Rotation Method: Promax with Kaiser Normalization.
a. Rotation converged in 5 iterations.
Factor Correlation Matrix
1 | 2 | 3 | 4 | 5 | |
1 | 1.000 | .554 | .413 | -.015 | .357 |
2 | .554 | 1.000 | .437 | .013 | .219 |
3 | .413 | .437 | 1.000 | .011 | .296 |
4 | -.015 | .013 | .011 | 1.000 | .104 |
5 | .357 | .219 | .296 | .104 | 1.000 |
Extraction Method: Principal Axis Factoring.
Rotation Method: Promax with Kaiser Normalization.
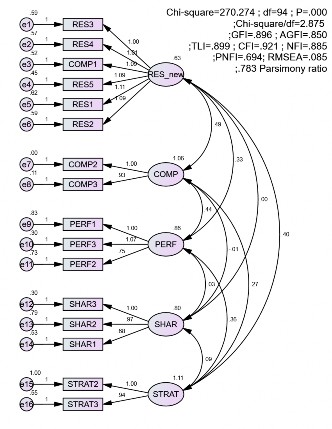
Result (Default model) Minimum was achieved Chi-square = 270.274 Degrees of freedom = 94 Probability level = .000
Regression Weights: (Group number 1 - Default model)
Estimate | S.E. | C.R. | P | Label | |||
RES3 | <--- | RES_new | 1.000 | ||||
RES4 | <--- | RES_new | 1.007 | .090 | 11.168 | *** | |
COMP1 | <--- | RES_new | 1.089 | .092 | 11.823 | *** | |
RES5 | <--- | RES_new | 1.094 | .090 | 12.151 | *** | |
RES1 | <--- | RES_new | 1.113 | .097 | 11.480 | *** |
Estimate | S.E. | C.R. | P | Label | |||
RES2 | <--- | RES_new | 1.086 | .095 | 11.495 | *** | |
COMP2 | <--- | COMP | 1.000 | ||||
COMP3 | <--- | COMP | .929 | .033 | 27.946 | *** | |
PERF1 | <--- | PERF | 1.000 | ||||
PERF3 | <--- | PERF | 1.073 | .103 | 10.431 | *** | |
PERF2 | <--- | PERF | .750 | .082 | 9.136 | *** | |
SHAR3 | <--- | SHAR | 1.000 | ||||
SHAR2 | <--- | SHAR | .970 | .111 | 8.745 | *** | |
SHAR1 | <--- | SHAR | .679 | .080 | 8.432 | *** | |
STRA2 | <--- | STRAT | 1.000 | ||||
STRA3 | <--- | STRAT | .937 | .141 | 6.655 | *** |
Standardized Regression Weights: (Group number 1 - Default model)
Estimate | |||
RES3 | <--- | RES_new | .720 |
RES4 | <--- | RES_new | .727 |
COMP1 | <--- | RES_new | .770 |
RES5 | <--- | RES_new | .792 |
RES1 | <--- | RES_new | .747 |
RES2 | <--- | RES_new | .748 |
COMP2 | <--- | COMP | .998 |
COMP3 | <--- | COMP | .945 |
PERF1 | <--- | PERF | .713 |
PERF3 | <--- | PERF | .877 |
PERF2 | <--- | PERF | .631 |
SHAR3 | <--- | SHAR | .855 |
SHAR2 | <--- | SHAR | .699 |
SHAR1 | <--- | SHAR | .639 |
STRA2 | <--- | STRAT | .726 |
STRA3 | <--- | STRAT | .800 |
Covariances: (Group number 1 - Default model)
Estimate | S.E. | C.R. | P | Label | |||
RES_new | <--> | COMP | .490 | .068 | 7.171 | *** | |
RES_new | <--> | PERF | .326 | .064 | 5.072 | *** | |
RES_new | <--> | SHAR | .000 | .052 | -.009 | .992 | |
RES_new | <--> | STRAT | .404 | .082 | 4.949 | *** | |
COMP | <--> | PERF | .441 | .077 | 5.720 | *** | |
COMP | <--> | SHAR | -.006 | .063 | -.089 | .929 | |
COMP | <--> | STRAT | .267 | .083 | 3.200 | .001 | |
PERF | <--> | SHAR | .033 | .062 | .529 | .597 | |
PERF | <--> | STRAT | .358 | .090 | 3.971 | *** | |
SHAR | <--> | STRAT | .092 | .076 | 1.219 | .223 |
Correlations: (Group number 1 - Default model)
Estimate | |||
RES_new | <--> | COMP | .597 |
RES_new | <--> | PERF | .442 |
RES_new | <--> | SHAR | -.001 |
RES_new | <--> | STRAT | .482 |
COMP | <--> | PERF | .461 |
COMP | <--> | SHAR | -.006 |
COMP | <--> | STRAT | .246 |
PERF | <--> | SHAR | .040 |
PERF | <--> | STRA | .366 |
SHAR | <--> | STRA | .098 |
Variances: (Group number 1 - Default model)
Estimate | S.E. | C.R. | P | Label | ||
RES_new | .633 | .098 | 6.481 | *** | ||
COMP | 1.064 | .098 | 10.850 | *** | ||
PERF | .861 | .144 | 5.969 | *** | ||
SHAR | .801 | .120 | 6.680 | *** | ||
STRAT | 1.110 | .223 | 4.984 | *** | ||
e1 | .587 | .059 | 10.011 | *** | ||
e2 | .573 | .058 | 9.956 | *** | ||
e3 | .515 | .054 | 9.503 | *** | ||
e4 | .450 | .049 | 9.198 | *** | ||
e5 | .621 | .064 | 9.761 | *** | ||
e6 | .587 | .060 | 9.751 | *** | ||
e7 | .004 | .030 | .117 | .907 | ||
e8 | .111 | .028 | 3.967 | *** | ||
e9 | .833 | .097 | 8.551 | *** | ||
e10 | .299 | .076 | 3.944 | *** | ||
e11 | .731 | .075 | 9.768 | *** | ||
e12 | .296 | .081 | 3.662 | *** | ||
e13 | .786 | .100 | 7.896 | *** | ||
e14 | .534 | .059 | 9.117 | *** | ||
e15 | .996 | .176 | 5.667 | *** | ||
e16 | .548 | .142 | 3.851 | *** |
CR | AVE | MSV | MaxR(H) | SHAR | RES_new | COMP | PERF | STRAT | |
SHART | 0.778 | 0.543 | 0.010 | 0.814 | 0.737 | ||||
RES_new | 0.870 | 0.573 | 0.232 | 0.872 | -0.001 | 0.757 | |||
COMP | 0.971 | 0.945 | 0.213 | 0.996 | -0.006 | ||||
PERF | 0.788 | 0.559 | 0.213 | 0.834 | 0.040 | 0.442 | 0.461 | ||
STRA | 0.737 | 0.584 | 0.232 | 0.743 | 0.098 | 0.482 | 0.246 | 0.366 |
No Validity Concerns - Wahoo!
Regression Weights: (Group number 1 - Default model)
Estimate | S.E. | C.R. | P | Label | |||
STRA | <--- | RES_new | .633 | .118 | 5.356 | *** | |
SHAR | <--- | RES_new | -.067 | .099 | -.678 | .497 | |
SHAR | <--- | STRA | .108 | .082 | 1.317 | .188 | |
COMP | <--- | RES_new | .772 | .085 | 9.127 | *** | |
COMP | <--- | SHAR | -.009 | .066 | -.132 | .895 | |
PERF | <--- | RES_new | .320 | .100 | 3.197 | .001 | |
PERF | <--- | COMP | .265 | .073 | 3.644 | *** | |
RES3 | <--- | RES_new | 1.000 | ||||
RES4 | <--- | RES_new | 1.005 | .090 | 11.151 | *** | |
COMP1 | <--- | RES_new | 1.089 | .092 | 11.830 | *** | |
RES5 | <--- | RES_new | 1.095 | .090 | 12.168 | *** | |
RES1 | <--- | RES_new | 1.113 | .097 | 11.476 | *** | |
RES2 | <--- | RES_new | 1.085 | .094 | 11.485 | *** | |
COMP2 | <--- | COMP | 1.000 | ||||
COMP3 | <--- | COMP | .926 | .033 | 27.648 | *** | |
PERF1 | <--- | PERF | 1.000 | ||||
PERF3 | <--- | PERF | 1.073 | .104 | 10.282 | *** | |
PERF2 | <--- | PERF | .763 | .083 | 9.185 | *** | |
SHAR3 | <--- | SHAR | 1.000 | ||||
SHAR2 | <--- | SHAR | .972 | .111 | 8.749 | *** | |
SHAR1 | <--- | SHAR | .680 | .081 | 8.435 | *** | |
STRA2 | <--- | STRA | 1.000 | ||||
STRA3 | <--- | STRA | .952 | .153 | 6.209 | *** |
Standardized Regression Weights: (Group number 1 - Default model)
Estimate | |||
STRA | <--- | RES_new | .482 |
SHAR | <--- | RES_new | -.060 |
SHAR | <--- | STRA | .126 |
COMP | <--- | RES_new | .594 |
COMP | <--- | SHAR | -.008 |
PERF | <--- | RES_new | .275 |
PERF | <--- | COMP | .297 |
RES3 | <--- | RES_new | .720 |
RES4 | <--- | RES_new | .726 |
COMP1 | <--- | RES_new | .770 |
RES5 | <--- | RES_new | .793 |
RES1 | <--- | RES_new | .747 |
RES2 | <--- | RES_new | .748 |
COMP2 | <--- | COMP | 1.000 |
COMP3 | <--- | COMP | .943 |
PERF1 | <--- | PERF | .710 |
PERF3 | <--- | PERF | .873 |
PERF2 | <--- | PERF | .640 |
SHAR3 | <--- | SHAR | .854 |
SHAR2 | <--- | SHAR | .700 |
SHAR1 | <--- | SHAR | .639 |
STRA2 | <--- | STRA | .720 |
STRA3 | <--- | STRA | .807 |