2.5 Biến Mối quan hệ với cấp trên
Reliability Statistics
Cronbach's
Alpha N of Items
.835 4
Item-Total Statistics
Corrected Item-
Cronbach's
CT1 | 11.73 | 3.150 | .675 | .791 |
CT2 | 11.85 | 2.797 | .682 | .785 |
CT3 | 11.79 | 2.997 | .657 | .795 |
CT4 | 11.78 | 2.911 | .657 | .796 |
Có thể bạn quan tâm!
-
 Đánh Giá Của Người Lao Động Về “Sự Hài Lòng Trong Công Việc”
 -
 Giải Pháp Về Quan Hệ Với Đồng Nghiệp
 -
 Thống Kê Mô Tả Đặc Điểm Mẫu Khảo Sát
 -
 Phân tích các yếu tố ảnh hưởng đến sự hài lòng trong công việc của người lao động tại Công ty Cổ phần Đầu tư Châu Á - Thái Bình Dương Apec Group – Hội sở Hà Nội - 15
 -
 Phân tích các yếu tố ảnh hưởng đến sự hài lòng trong công việc của người lao động tại Công ty Cổ phần Đầu tư Châu Á - Thái Bình Dương Apec Group – Hội sở Hà Nội - 16
Xem toàn bộ 134 trang tài liệu này.
Scale Mean if Item Deleted
Scale Variance if Item Deleted
Total Correlation
Alpha if Item Deleted
2.6. Biến Cơ hội thăng tiến
Reliability Statistics
Cronbach's
Alpha N of Items
.812 4
Item-Total Statistics
Corrected Item-
Cronbach's
TT1 | 11.71 | 4.853 | .357 | .870 |
TT2 | 11.71 | 3.400 | .759 | .698 |
TT3 | 11.71 | 3.333 | .709 | .724 |
TT4 | 11.69 | 3.559 | .721 | .719 |
Scale Mean if Item Deleted
Scale Variance if Item Deleted
Total Correlation
Alpha if Item Deleted
Loại bỏ biến TT1, ta có hệ số mới như sau:
Reliability Statistics
Cronbach's
Alpha N of Items
.870 3
Item-Total Statistics
Corrected Item-
Cronbach's
TT2 | 7.81 | 2.381 | .723 | .842 |
TT3 | 7.81 | 2.153 | .764 | .807 |
TT4 | 7.79 | 2.357 | .771 | .801 |
Scale Mean if Item Deleted
Scale Variance if Item Deleted
Total Correlation
Alpha if Item Deleted
2.7. Biến Văn hóa doanh nghiệp
Reliability Statistics
Cronbach's
Alpha N of Items
.875 4
Item-Total Statistics
Corrected Item-
Cronbach's
VH1 | 11.59 | 4.365 | .792 | .819 |
VH2 | 11.58 | 4.487 | .675 | .862 |
VH3 | 11.59 | 4.325 | .699 | .854 |
VH4 | 11.57 | 4.234 | .769 | .826 |
Scale Mean if Item Deleted
Scale Variance if Item Deleted
Total Correlation
Alpha if Item Deleted
2.8 Biến Sự hài lòng trong công việc
Reliability Statistics
Cronbach's
Alpha N of Items
.648 3
Item-Total Statistics
Corrected Item-
Cronbach's
HL1 | 8.07 | 1.102 | .454 | .555 |
HL2 | 8.01 | 1.013 | .489 | .507 |
HL3 | 8.01 | 1.154 | .432 | .585 |
Scale Mean if Item Deleted
Scale Variance if Item Deleted
Total Correlation
Alpha if Item Deleted
3. Phân tích nhân tố khám phá EFA
3.1 Các biến độc lập
KMO and Bartlett's Test
.802 | ||
Bartlett's Test of Sphericity | Approx. Chi-Square | 1879.917 |
df | 300 | |
Sig. | .000 | |
Initial Eigenvalues
Total Variance Explained
Extraction Sums of Squared Loadings
Rotation Sums of Squared Loadings
1 | 6.132 | 24.529 | 24.529 | 6.132 | 24.529 | 24.529 | 3.102 | 12.406 | 12.406 |
2 | 2.656 | 10.623 | 35.153 | 2.656 | 10.623 | 35.153 | 3.010 | 12.040 | 24.447 |
3 | 2.474 | 9.894 | 45.047 | 2.474 | 9.894 | 45.047 | 2.802 | 11.209 | 35.656 |
4 | 2.326 | 9.305 | 54.352 | 2.326 | 9.305 | 54.352 | 2.741 | 10.966 | 46.622 |
5 | 1.770 | 7.079 | 61.430 | 1.770 | 7.079 | 61.430 | 2.375 | 9.499 | 56.121 |
6 | 1.547 | 6.187 | 67.617 | 1.547 | 6.187 | 67.617 | 2.260 | 9.038 | 65.160 |
7 | 1.372 | 5.490 | 73.107 | 1.372 | 5.490 | 73.107 | 1.987 | 7.947 | 73.107 |
8 | .722 | 2.890 | 75.997 | ||||||
9 | .581 | 2.323 | 78.319 | ||||||
10 | .572 | 2.288 | 80.607 | ||||||
11 | .506 | 2.022 | 82.629 | ||||||
12 | .497 | 1.987 | 84.616 | ||||||
13 | .457 | 1.828 | 86.445 | ||||||
14 | .423 | 1.693 | 88.138 | ||||||
15 | .381 | 1.525 | 89.663 | ||||||
16 | .366 | 1.466 | 91.129 | ||||||
17 | .337 | 1.348 | 92.476 |
Compone nt
Total
% of Variance
Cumulative
% Total
% of Variance
Cumulative
% Total
% of Variance
Cumulative
%
.322 | 1.289 | 93.765 | |
19 | .289 | 1.157 | 94.922 |
20 | .278 | 1.113 | 96.035 |
21 | .257 | 1.028 | 97.063 |
22 | .200 | .801 | 97.864 |
23 | .189 | .755 | 98.619 |
24 | .175 | .698 | 99.317 |
25 | .171 | .683 | 100.000 |
Extraction Method: Principal Component Analysis.
Rotated Component Matrixa
Component
1 2 3 4 5 6 7
.863 | |
BC3 | .841 |
BC2 | .836 |
BC1 | .830 |
VH1 | .873 |
VH4 | .852 |
VH3 | .822 |
VH2 | .772 |
TL4 | .829 |
TL2 | .826 |
TL1 | .774 |
TL3 | .740 |
CT1 | .845 |
CT4 | .794 |
CT3 | .790 |
CT2 | .779 |
TT4 | .873 |
TT2 | .842 |
TT3 | .820 |
ĐK3 | .854 |
ĐK1 | .853 |
ĐK2 | .788 |
ĐN3 | .818 |
ĐN1 | .791 |
ĐN2 | .759 |
Extraction Method: Principal Component Analysis. Rotation Method: Varimax with Kaiser Normalization.
a. Rotation converged in 6 iterations.
3.2 Biến phụ thuộc
KMO and Bartlett's Test
.650 | ||
Bartlett's Test of Sphericity | Approx. Chi-Square | 58.290 |
df | 3 | |
Sig. | .000 | |
1 | 1.760 | 58.678 | 58.678 | 1.760 | 58.678 | 58.678 | |
2 | .663 | 22.113 | 80.792 | ||||
3 | .576 | 19.208 | 100.000 | ||||
Component
Total Variance Explained
Initial Eigenvalues Extraction Sums of Squared Loadings Total % of Variance Cumulative % Total % of Variance Cumulative %
Extraction Method: Principal Component Analysis.
Component Matrixa
Component
1
.792 | |
HL1 | .763 |
HL3 | .742 |
Extraction Method: Principal Component Analysis.
a. 1 components extracted.
4. Tương quan Pearson
Correlations
HL BC DK TL DN CT TT VH
Pearson Correlation | 1 | .518** | .461** | .484** | .278** | .364** | .496** | .399** | |
Sig. (2-tailed) | .000 | .000 | .000 | .001 | .000 | .000 | .000 | ||
N | 150 | 150 | 150 | 150 | 150 | 150 | 150 | 150 | |
BC | Pearson Correlation | .518** | 1 | .353** | .275** | .133 | .213** | .207* | .169* |
Sig. (2-tailed) | .000 | .000 | .001 | .104 | .009 | .011 | .039 | ||
N | 150 | 150 | 150 | 150 | 150 | 150 | 150 | 150 | |
DK | Pearson Correlation | .461** | .353** | 1 | .162* | .078 | .211** | .260** | .378** |
Sig. (2-tailed) | .000 | .000 | .047 | .345 | .010 | .001 | .000 | ||
N | 150 | 150 | 150 | 150 | 150 | 150 | 150 | 150 | |
TL | Pearson Correlation | .484** | .275** | .162* | 1 | .211** | .212** | .390** | .205* |
Sig. (2-tailed) | .000 | .001 | .047 | .009 | .009 | .000 | .012 | ||
N | 150 | 150 | 150 | 150 | 150 | 150 | 150 | 150 | |
DN | Pearson Correlation | .278** | .133 | .078 | .211** | 1 | .034 | .134 | .084 |
Sig. (2-tailed) | .001 | .104 | .345 | .009 | .684 | .101 | .308 | ||
N | 150 | 150 | 150 | 150 | 150 | 150 | 150 | 150 | |
CT | Pearson Correlation | .364** | .213** | .211** | .212** | .034 | 1 | .280** | .178* |
Sig. (2-tailed) | .000 | .009 | .010 | .009 | .684 | .001 | .029 | ||
N | 150 | 150 | 150 | 150 | 150 | 150 | 150 | 150 | |
TT | Pearson Correlation | .496** | .207* | .260** | .390** | .134 | .280** | 1 | .288** |
Sig. (2-tailed) | .000 | .011 | .001 | .000 | .101 | .001 | .000 | ||
N | 150 | 150 | 150 | 150 | 150 | 150 | 150 | 150 | |
VH | Pearson Correlation | .399** | .169* | .378** | .205* | .084 | .178* | .288** | 1 |
Sig. (2-tailed) | .000 | .039 | .000 | .012 | .308 | .029 | .000 | ||
N | 150 | 150 | 150 | 150 | 150 | 150 | 150 | 150 | |
**. Correlation is significant at the 0.01 level (2-tailed).
*. Correlation is significant at the 0.05 level (2-tailed).
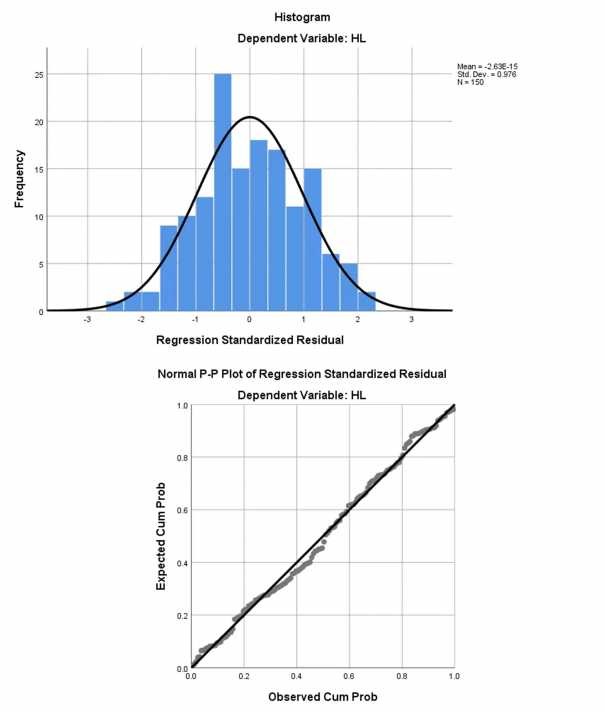
5. Hồi quy đa biến
Model Summaryb
1 | .761a | .579 | .558 | .320 | .579 | 27.847 | 7 | 142 | .000 | 2.114 |
Model R
R
Square
Adjusted R Square
Std. Error of the Estimate
R Square Change
Change Statistics F
Change df1 df2
Sig. F Change
Durbin- Watson
a. Predictors: (Constant), VH, DN, CT, BC, TL, TT, DK
b. Dependent Variable: HL
ANOVAa
Model Sum of Squares df Mean Square F Sig.
Regression | 19.971 | 7 | 2.853 | 27.847 | .000b |
Residual | 14.548 | 142 | .102 | ||
Total | 34.519 | 149 |
a. Dependent Variable: HL
b. Predictors: (Constant), VH, DN, CT, BC, TL, TT, DK
Unstandardized Coefficients
Coefficientsa Standardized Coefficients
Collinearity Statistics
Model
B Std. Error Beta
t Sig.
Tolerance VIF
(Constant) | .204 | .308 | .662 | .509 | |||
BC | .198 | .042 | .283 | 4.677 | .000 | .811 | 1.233 |
DK | .137 | .048 | .179 | 2.848 | .005 | .753 | 1.328 |
TL | .157 | .047 | .207 | 3.352 | .001 | .778 | 1.286 |
DN | .129 | .053 | .137 | 2.445 | .016 | .945 | 1.058 |
CT | .114 | .050 | .132 | 2.271 | .025 | .877 | 1.140 |
TT | .140 | .041 | .213 | 3.404 | .001 | .758 | 1.319 |
VH | .102 | .043 | .145 | 2.390 | .018 | .810 | 1.235 |
a. Dependent Variable: HL
6. Đánh giá của nhân viên với từng yếu tố
6.1. Bản chất công việc
Statistics
BC1 BC2 BC3 BC4 BC
Valid | 150 | 150 | 150 | 150 | 150 | |
Missing | 0 | 0 | 0 | 0 | 0 | |
Mean | 3.91 | 3.88 | 3.87 | 3.91 | 3.89 | |