Total Variance Explained
Initial Eigenvalues | Extraction Sums of Squared Loadings | |||||
Total | % of Variance | Cumulative % | Total | % of Variance | Cumulative % | |
1 | 1.884 | 62.793 | 62.793 | 1.884 | 62.793 | 62.793 |
2 | .617 | 20.583 | 83.376 | |||
3 | .499 | 16.624 | 100.000 |
Có thể bạn quan tâm!
-

 Theo Chuyên Gia Các Nhân Tố Nào Dưới Đây Ảnh Hưởng Đến Vận Dụng Công Tác Kế Toán Quản Trị Tại Các Doanh Nghiệp Trong Khu Công Nghiệp Vĩnh Lộc?
 -
 Nghiên cứu việc vận dụng công tác kế toán quản trị tại công ty cổ phần nước – môi trường Bình Dương - 17
 -
 Kết Quả Kiểm Định Mô Hình Nghiên Cứu
 -
 Nghiên cứu việc vận dụng công tác kế toán quản trị tại công ty cổ phần nước – môi trường Bình Dương - 20
Xem toàn bộ 166 trang tài liệu này.
Extraction Method: Principal Component Analysis.
Component Matrixa
Component | |
1 | |
KTQT1 | .820 |
KTQT3 | .798 |
KTQT2 | .758 |
Extraction Method: Principal Component Analysis.
a. 1 components extracted.
NCTT | NTLD | BMQL | PPKT | NLKT | CNTT | MDCT | KTQT | ||
NCTT | Pearson Correlati on | 1 | .030 | .149* | .112 | .206** | .050 | .158* | .406** |
Sig. (2- tailed) | .682 | .038 | .118 | .004 | .491 | .027 | .000 | ||
N | 195 | 195 | 195 | 195 | 195 | 195 | 195 | 195 | |
NTLD | Pearson Correlati on | .030 | 1 | .180* | .207** | .157* | .189** | .321** | .441** |
Sig. (2- tailed) | .682 | .012 | .004 | .029 | .008 | .000 | .000 | ||
N | 195 | 195 | 195 | 195 | 195 | 195 | 195 | 195 | |
BMQL | Pearson Correlati on | .149* | .180* | 1 | .133 | .392** | .250** | .323** | .498** |
Sig. (2- tailed) | .038 | .012 | .063 | .000 | .000 | .000 | .000 | ||
N | 195 | 195 | 195 | 195 | 195 | 195 | 195 | 195 | |
PPKT | Pearson Correlati on | .112 | .207** | .133 | 1 | -.040 | .302** | .124 | .332** |
Sig. (2- tailed) | .118 | .004 | .063 | .580 | .000 | .084 | .000 | ||
N | 195 | 195 | 195 | 195 | 195 | 195 | 195 | 195 | |
NLKT | Pearson Correlati on | .206** | .157* | .392** | -.040 | 1 | -.002 | .193** | .423** |
Sig. (2- tailed) | .004 | .029 | .000 | .580 | .977 | .007 | .000 | ||
N | 195 | 195 | 195 | 195 | 195 | 195 | 195 | 195 |
Correlations
CNTT | Pearson Correlati on | .050 | .189** | .250** | .302** | -.002 | 1 | .162* | .393** |
Sig. (2- tailed) | .491 | .008 | .000 | .000 | .977 | .024 | .000 | ||
N | 195 | 195 | 195 | 195 | 195 | 195 | 195 | 195 | |
MDCT | Pearson Correlati on | .158* | .321** | .323** | .124 | .193** | .162* | 1 | .413** |
Sig. (2- tailed) | .027 | .000 | .000 | .084 | .007 | .024 | .000 | ||
N | 195 | 195 | 195 | 195 | 195 | 195 | 195 | 195 | |
KTQT | Pearson Correlati on | .406** | .441** | .498** | .332** | .423** | .393** | .413** | 1 |
Sig. (2- tailed) | .000 | .000 | .000 | .000 | .000 | .000 | .000 | ||
N | 195 | 195 | 195 | 195 | 195 | 195 | 195 | 195 |
*.
Correlation is significant at the 0.05 level (2-tailed).
**. Correlation is significant at the 0.01 level (2-tailed).
Model Summaryb
R | R Square | Adjust ed R Square | Std. Error of the Estima te | Change Statistic s | Durbi n- Wats on | |||||
R Squar e Chan ge | F Chang e | df1 | df2 | Sig. F Chan ge | ||||||
1 | .779 a | .60 7 | .59 2 | .3670 3 | .60 7 | 41.29 5 | 7 | 18 7 | .00 0 | 1.08 2 |
a. Predictors: (Constant), MDCT, PPKT, NCTT, NLKT, CNTT, NTLD, BMQL
b. Dependent Variable: KTQT
ANOVAa
Sum of Squares | df | Mean Square | F | Sig. | ||
1 | Regression | 38.939 | 7 | 5.563 | 41.295 | .000b |
Residual | 25.190 | 187 | .135 | |||
Total | 64.129 | 194 |
a. Dependent Variable: KTQT
b. Predictors: (Constant), MDCT, PPKT, NCTT, NLKT, CNTT, NTLD, BMQL
Coefficientsa
Unstandardized Coefficients | Standardized Coefficients | t | Sig. | Correlations | Collinearity Statistics | ||||||
B | Std. Error | Beta | Zero- order | Partial | Part | Tolerance | VIF | ||||
1 | (Constant) | -1.302 | .325 | -4.010 | .000 | ||||||
NCTT | .309 | .054 | .273 | 5.739 | .000 | .406 | .387 | .263 | .927 | 1.078 | |
NTLD | .231 | .046 | .248 | 4.970 | .000 | .441 | .342 | .228 | .845 | 1.184 |
.179 | .046 | .209 | 3.903 | .000 | .498 | .274 | .179 | .734 | 1.363 | |
PPKT | .140 | .046 | .151 | 3.062 | .003 | .332 | .218 | .140 | .865 | 1.156 |
NLKT | .258 | .058 | .229 | 4.435 | .000 | .423 | .308 | .203 | .791 | 1.264 |
CNTT | .141 | .033 | .216 | 4.323 | .000 | .393 | .301 | .198 | .844 | 1.185 |
MDCT | .112 | .046 | .125 | 2.447 | .015 | .413 | .176 | .112 | .809 | 1.236 |
a. Dependent Variable: KTQT
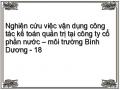
Normal P-P Plot of Regression Standardized Residual Dependent Variable: KTQT
Observed Cum Prob
2-
q O
1-
0-
-1-
-2-
-2
0
2
Scatterplot Dependent Variable: KTQT
Regression Standardized Predicted Value
30
31

32
33