9.6645 | 2.437 | .695 | .856 | |
QD4 | 9.6645 | 2.377 | .715 | .849 |
Có thể bạn quan tâm!
-

 Giá Trị Trung Bình Của Các Biến Quan Sát Trong Nhân Tố “Đặc Tính Sản Phẩm”
 -
 Vị Trí Công Tác Tại Công Ty Của Anh/chị Là:
 -
 Nghiên cứu các yếu tố ảnh hưởng đến quyết định mua tấm thạch cao của doanh nghiệp tư nhân thương mại Huy An từ các khách hàng tổ chức tại thành phố Hồ Chí Minh - 11
 -
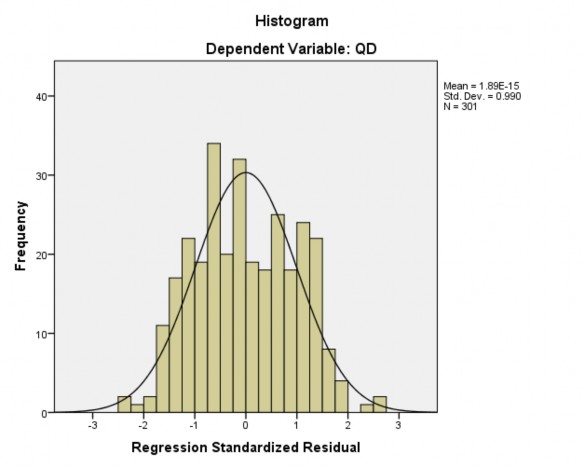
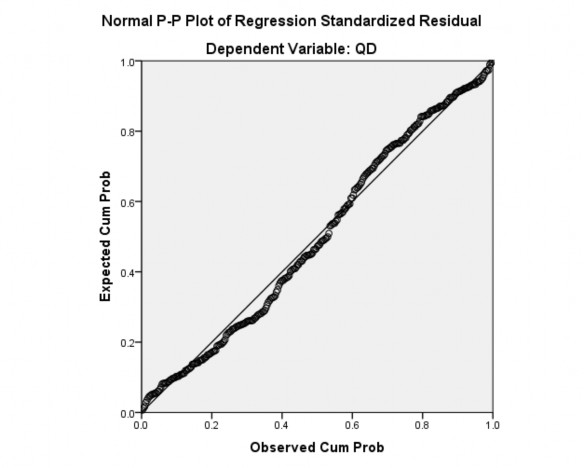
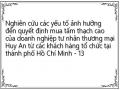 Nghiên cứu các yếu tố ảnh hưởng đến quyết định mua tấm thạch cao của doanh nghiệp tư nhân thương mại Huy An từ các khách hàng tổ chức tại thành phố Hồ Chí Minh - 13
Xem toàn bộ 109 trang tài liệu này.
2. Phân tích EFA ![]() Biến độc lập
Biến độc lập
KMO and Bartlett's Test | ||
Kaiser-Meyer-Olkin Measure of Sampling Adequacy. | .859 | |
Bartlett's Test of Sphericity | Approx. Chi-Square | 3695.224 |
df | 378 | |
Sig. | .000 | |
Total Variance Explained
Initial Eigenvalues | Extraction Sums of Squared Loadings | |||||
Total | % of Variance | Cumulative % | Total | % of Variance | Cumulative % | |
1 | 6.928 | 24.742 | 24.742 | 6.928 | 24.742 | 24.742 |
2 | 3.128 | 11.170 | 35.913 | 3.128 | 11.170 | 35.913 |
3 | 2.850 | 10.178 | 46.091 | 2.850 | 10.178 | 46.091 |
4 | 1.801 | 6.431 | 52.523 | 1.801 | 6.431 | 52.523 |
5 | 1.509 | 5.390 | 57.913 | 1.509 | 5.390 | 57.913 |
6 | 1.238 | 4.422 | 62.334 | 1.238 | 4.422 | 62.334 |
7 | .932 | 3.329 | 65.664 | |||
8 | .872 | 3.114 | 68.777 | |||
9 | .751 | 2.681 | 71.458 | |||
10 | .702 | 2.506 | 73.965 | |||
11 | .668 | 2.387 | 76.352 | |||
12 | .619 | 2.212 | 78.564 | |||
13 | .564 | 2.015 | 80.579 | |||
14 | .535 | 1.910 | 82.488 | |||
15 | .502 | 1.793 | 84.282 | |||
16 | .482 | 1.721 | 86.003 | |||
17 | .448 | 1.600 | 87.602 | |||
18 | .434 | 1.549 | 89.151 | |||
19 | .397 | 1.418 | 90.569 | |||
20 | .388 | 1.385 | 91.954 | |||
21 | .343 | 1.227 | 93.180 | |||
22 | .328 | 1.171 | 94.351 |
.316 | 1.129 | 95.480 | |
24 | .289 | 1.031 | 96.511 |
25 | .266 | .949 | 97.460 |
26 | .256 | .913 | 98.373 |
27 | .239 | .852 | 99.225 |
28 | .217 | .775 | 100.000 |
Rotated Component Matrixa
Component | ||||||
1 | 2 | 3 | 4 | 5 | 6 | |
CH2 | .851 | |||||
CH3 | .812 | |||||
CH4 | .698 | |||||
CH1 | .685 | |||||
CH5 | .590 | |||||
DVKH2 | .793 | |||||
DVKH1 | .767 | |||||
DVKH4 | .762 | |||||
DVKH5 | .649 | |||||
DVKH3 | .632 | |||||
DT2 | .885 | |||||
DT3 | .870 | |||||
DT1 | .869 | |||||
DT5 | .797 | |||||
TH4 | .823 | |||||
TH3 | .816 | |||||
TH2 | .797 | |||||
TH5 | .674 | |||||
TH1 | .653 | |||||
GC4 | .756 | |||||
GC2 | .699 | |||||
GC5 | .689 | |||||
GC1 | .634 | |||||
GC3 | .552 | |||||
GH2 | .754 | |||||
GH4 | .714 | |||||
GH1 | .712 | |||||
GH3 | .658 |
![]() Biến phụ thuộc
Biến phụ thuộc
KMO and Bartlett's Test
.806 | ||
Bartlett's Test of Sphericity | Approx. Chi-Square | 628.7 92 |
df | 6 | |
Sig. | .000 |
Total Variance Explained
Initial Eigenvalues | Extraction Sums of Squared Loadings | |||||
Total | % of Variance | Cumulative % | Total | % of Variance | Cumulative % | |
1 | 2.921 | 73.029 | 73.029 | 2.921 | 73.029 | 73.029 |
2 | .477 | 11.924 | 84.953 | |||
3 | .361 | 9.035 | 93.988 | |||
4 | .240 | 6.012 | 100.000 |
Component Matrixa
Component | |
1 | |
QD2 | .890 |
QD1 | .859 |
QD4 | .841 |
QD3 | .827 |
3. Tương quan và hồi quy ![]() Tương quan Pearson
Tương quan Pearson
Correlations
DT | GC | GH | TH | DVKH | CH | ||
DT | Pearson Correlation | 1 | -.084 | .049 | .061 | .007 | -.068 |
Sig. (2-tailed) | .145 | .400 | .294 | .899 | .236 | ||
N | 301 | 301 | 301 | 301 | 301 | 301 | |
GC | Pearson Correlation | -.084 | 1 | .468** | .002 | .463** | .419** |
Sig. (2-tailed) | .145 | .000 | .967 | .000 | .000 | ||
N | 301 | 301 | 301 | 301 | 301 | 301 | |
GH | Pearson Correlation | .049 | .468** | 1 | -.096 | .567** | .471** |
Sig. (2-tailed) | .400 | .000 | .097 | .000 | .000 |
301 | 301 | 301 | 301 | 301 | 301 | ||
TH | Pearson Correlation | .061 | .002 | -.096 | 1 | -.075 | -.031 |
Sig. (2-tailed) | .294 | .967 | .097 | .192 | .593 | ||
N | 301 | 301 | 301 | 301 | 301 | 301 | |
DV KH | Pearson Correlation | .007 | .463** | .567** | -.075 | 1 | .478** |
Sig. (2-tailed) | .899 | .000 | .000 | .192 | .000 | ||
N | 301 | 301 | 301 | 301 | 301 | 301 | |
CH | Pearson Correlation | -.068 | .419** | .471** | -.031 | .478** | 1 |
Sig. (2-tailed) | .236 | .000 | .000 | .593 | .000 | ||
N | 301 | 301 | 301 | 301 | 301 | 301 | |
QD | Pearson Correlation | .350** | .539** | .568** | .221** | .499** | .518** |
Sig. (2-tailed) | .000 | .000 | .000 | .000 | .000 | .000 | |
N | 301 | 301 | 301 | 301 | 301 | 301 |
![]() Hồi quy
Hồi quy
Variables Entered/Removeda
Variables Entered | Variables Removed | Method | |
1 | CH, TH, DT, GC, DVKH, GHb | . | Enter |
Model Summaryb
R | R Square | Adjusted R Square | Std. Error of the Estimate | Durbin-Watson | |
1 | .818a | .669 | .662 | .29035 | 2.071 |
ANOVAa
Sum of Squares | df | Mean Square | F | Sig. | ||
1 | Regression | 50.128 | 6 | 8.355 | 99.105 | .000b |
Residual | 24.785 | 294 | .084 | |||
Total | 74.912 | 300 |
Coefficientsa
Unstandardized Coefficients | Standardized Coefficients | t | Sig. | Collinearity Statistics | |||
B | Std. Error | Beta | Tolerance | ||||
1 | (Constant) | -.329 | .154 | .224 | -2.138 | .033 | .971 |
DT | .169 | .026 | 10.699 | .000 |
GC | .247 | .034 | .292 | 7.215 | .000 | .686 |
GH | .207 | .036 | .251 | 5.707 | .000 | .584 |
TH | .177 | .025 | .238 | 7.036 | .000 | .981 |
DVKH | .095 | .036 | .115 | 2.626 | .009 | .591 |
CH | .206 | .033 | .250 | 6.285 | .000 | .682 |
Coefficientsa
Collinearity Statistics | ||
VIF | ||
1 | (Constant) | 1.030 |
DT | ||
GC | 1.457 | |
GH | 1.714 | |
TH | 1.020 | |
DVKH | 1.691 | |
CH | 1.467 |
4. Kiểm định sự khác biệt ![]() Theo giới tính
Theo giới tính
Group Statistics
N | Mean | Std. Deviation | Std. Error Mean | ||
QD | NAM | 148 | 3.2230 | .48981 | .04026 |
NU | 153 | 3.2239 | .51071 | .04129 |
Independent Samples Test
Levene's Test for Equality of Variances | t-test for Equality of Means | ||||
F | Sig. | t | df | ||
QD | Equal variances assumed | .331 | .565 | -.015 | 299 |
Equal variances not assumed | -.015 | 298.979 |