1.000 | .520 | |
THQ1 | 1.000 | .663 |
THQ2 | 1.000 | .900 |
THQ3 | 1.000 | .618 |
THQ4 | 1.000 | .837 |
CCQ1 | 1.000 | .597 |
CCQ2 | 1.000 | .719 |
CCQ3 | 1.000 | .703 |
CCQ4 | 1.000 | .665 |
Có thể bạn quan tâm!
-
 Nghiên cứu các nhân tố ảnh hưởng đến quyết định sử dụng dịch vụ Quản trị Fanpage của khách hàng tổ chức tại Công ty Philip Entertainment trên địa bàn Thành phố Huế - 15
 -
 Đánh Giá Thang Đo Bằng Hệ Số Tin Cậy Cronbach’S Alpha
 -
 Nghiên cứu các nhân tố ảnh hưởng đến quyết định sử dụng dịch vụ Quản trị Fanpage của khách hàng tổ chức tại Công ty Philip Entertainment trên địa bàn Thành phố Huế - 17
 -
 Nghiên cứu các nhân tố ảnh hưởng đến quyết định sử dụng dịch vụ Quản trị Fanpage của khách hàng tổ chức tại Công ty Philip Entertainment trên địa bàn Thành phố Huế - 19
Xem toàn bộ 152 trang tài liệu này.
Extraction Method: Principal Component Analysis.
Total Variance Explained
Initial Eigenvalues | Extraction Sums of Squared Loadings | Rotation Sums of Squared Loadings | |||||||
Total | % of Varianc e | Cumulativ e % | Total | % of Varianc e | Cumulativ e % | Total | % of Varianc e | Cumulativ e % | |
1 | 5.48 1 | 23.829 | 23.829 | 5.48 1 | 23.829 | 23.829 | 2.88 0 | 12.524 | 12.524 |
2 | 2.14 7 | 9.336 | 33.166 | 2.14 7 | 9.336 | 33.166 | 2.30 6 | 10.028 | 22.552 |
3 | 1.77 6 | 7.723 | 40.888 | 1.77 6 | 7.723 | 40.888 | 2.29 5 | 9.977 | 32.528 |
4 | 1.62 8 | 7.078 | 47.967 | 1.62 8 | 7.078 | 47.967 | 2.09 6 | 9.114 | 41.642 |
5 | 1.49 1 | 6.481 | 54.448 | 1.49 1 | 6.481 | 54.448 | 1.93 7 | 8.420 | 50.062 |
6 | 1.36 4 | 5.930 | 60.378 | 1.36 4 | 5.930 | 60.378 | 1.86 8 | 8.124 | 58.186 |
7 | 1.17 2 | 5.097 | 65.475 | 1.17 2 | 5.097 | 65.475 | 1.67 7 | 7.289 | 65.475 |
8 | .964 | 4.193 | 69.668 | ||||||
9 | .901 | 3.915 | 73.584 | ||||||
10 | .730 | 3.173 | 76.757 | ||||||
11 | .678 | 2.946 | 79.703 | ||||||
12 | .652 | 2.834 | 82.537 | ||||||
13 | .549 | 2.389 | 84.925 | ||||||
14 | .516 | 2.245 | 87.170 | ||||||
15 | .488 | 2.122 | 89.292 |
.473 | 2.057 | 91.349 | |
17 | .437 | 1.898 | 93.247 |
18 | .371 | 1.612 | 94.859 |
19 | .358 | 1.557 | 96.416 |
20 | .291 | 1.265 | 97.681 |
21 | .252 | 1.097 | 98.778 |
22 | .234 | 1.015 | 99.794 |
23 | .047 | .206 | 100.000 |
Extraction Method: Principal Component Analysis.
Rotated Component Matrixa
Component | |||||||
1 | 2 | 3 | 4 | 5 | 6 | 7 | |
THQ2 | .908 | ||||||
THQ4 | .866 | ||||||
THQ1 | .740 | ||||||
THQ3 | .706 | ||||||
SDU3 | .851 | ||||||
SDU2 | .708 | ||||||
SDU1 | .659 | ||||||
SDU4 | .597 | ||||||
TH2 | .746 | ||||||
TH3 | .735 | ||||||
TH4 | .664 | ||||||
TH1 | .636 | ||||||
GC2 | .766 | ||||||
GC3 | .764 | ||||||
GC4 | .617 | ||||||
GC1 | .595 | ||||||
CLSP2 | .810 | ||||||
CLSP3 | .750 | ||||||
CLSP1 | .679 | ||||||
CCQ2 | .774 | ||||||
CCQ1 | .742 | ||||||
CCQ4 | .751 | ||||||
CCQ3 | .657 |
Extraction Method: Principal Component Analysis. Rotation Method: Varimax with Kaiser Normalization.
a. Rotation converged in 7 iterations.
Component Transformation Matrix
1 | 2 | 3 | 4 | 5 | 6 | 7 | |
1 | .506 | .405 | .414 | .345 | .348 | .298 | .282 |
2 | -.752 | .425 | .148 | .455 | .080 | -.132 | .007 |
3 | -.111 | -.070 | -.663 | .274 | -.004 | .622 | .284 |
4 | .001 | -.600 | .008 | .429 | .596 | -.109 | -.297 |
5 | -.344 | -.475 | .545 | -.195 | -.063 | .352 | .439 |
6 | -.218 | .252 | -.063 | -.596 | .624 | .295 | -.231 |
7 | .007 | .012 | .255 | .145 | -.353 | .533 | -.711 |
Extraction Method: Principal Component Analysis. Rotation Method: Varimax with Kaiser Normalization.
Kết quả phân tích nhân tố khám phá EFA cho các biến phụ thuộc
Kết quả phân tích nhân tố khám phá EFA cho các biến phụ thuộc lần 1
KMO and Bartlett's Test
.613 | |
Approx. Chi-Square | 176.758 |
Bartlett's Test of Sphericity df | 6 |
Sig. | .000 |
Communalities
Initial | Extraction | |
QDSU1 | 1.000 | .249 |
QDSD2 | 1.000 | .583 |
QDSU3 | 1.000 | .788 |
QDSU4 | 1.000 | .644 |
Extraction Method: Principal Component Analysis.
Total Variance Explained
Initial | Eigenvalues | Extraction Sums of Squared Loadings | ||||
Total | % of Variance | Cumulative % | Total | % of Variance | Cumulative % | |
1 | 2.263 | 56.582 | 56.582 | 2.263 | 56.582 | 56.582 |
2 | .951 | 23.786 | 80.368 | |||
3 | .556 | 13.890 | 94.258 | |||
4 | .230 | 5.742 | 100.000 |
Extraction Method: Principal Component Analysis.
Component Matrixa
Component | |
1 | |
QDSU3 | .888 |
QDSU4 | .802 |
QDSD2 | .764 |
QDSU1 |
Extraction Method: Principal Component Analysis.
a. 1 components extracted.
Kết quả phân tích nhân tố khám phá EFA cho các biến phụ thuộc lần 2
KMO and Bartlett's Test
.589 | |
Approx. Chi-Square | 155.798 |
Bartlett's Test of Sphericity df | 3 |
Sig. | .000 |
Communalities
Initial | Extraction | |
QDSD2 | 1.000 | .536 |
QDSU3 | 1.000 | .852 |
QDSU4 | 1.000 | .721 |
Extraction Method: Principal Component Analysis.
Total Variance Explained
Initial | Eigenvalues | Extraction Sums of Squared Loadings | ||||
Total | % of Variance | Cumulative % | Total | % of Variance | Cumulative % | |
1 | 2.110 | 70.328 | 70.328 | 2.110 | 70.328 | 70.328 |
2 | .659 | 21.976 | 92.304 | |||
3 | .231 | 7.696 | 100.000 |
Extraction Method: Principal Component Analysis.
Component Matrixa
Component | |
1 | |
QDSU3 QDSU4 QDSD2 | .923 .849 .732 |
Extraction Method: Principal Component Analysis.
a. 1 components extracted.
4. Phân tích tương quan Pearson
Correlations
QDSD | TH | GC | CLSP | SDU | THQ | CCQ | PV | |
Pearson Correlation QDSD Sig. (2-tailed) N Pearson TH Correlation Sig. (2-tailed) N Pearson GC Correlation Sig. (2-tailed) | 1 | .447** | .474** | .391** | .510** | .435** | .386** | .402** |
.000 | .000 | .000 | .000 | .000 | .000 | .000 | ||
139 | 139 | 139 | 139 | 139 | 139 | 139 | 139 | |
.447** | 1 | .272** | .297** | .335** | .250** | .113 | .248** | |
.000 | .001 | .000 | .000 | .003 | .184 | .003 | ||
139 | 140 | 140 | 140 | 140 | 140 | 140 | 140 | |
.474** | .272** | 1 | .328** | .320** | .178* | .204* | .264** | |
.000 | .001 | .000 | .000 | .035 | .016 | .002 |
N Pearson Correlation Sig. (2-tailed) N Pearson Correlation Sig. (2-tailed) N Pearson Correlation Sig. (2-tailed) N Pearson Correlation Sig. (2-tailed) N Pearson Correlation Sig. (2-tailed) N | 139 | 140 | 140 | 140 | 140 | 140 | 140 | 140 |
.391** | .297** | .328** | 1 | .253** | .269** | .238** | .186* |
.000 | .000 | .000 | .003 | .001 | .005 | .028 | |
139 | 140 | 140 | 140 | 140 | 140 | 140 | 140 |
.510** | .335** | .320** | .253** | 1 | .246** | .218** | .285** |
.000 | .000 | .000 | .003 | .003 | .010 | .001 | |
139 | 140 | 140 | 140 | 140 | 140 | 140 | 140 |
.435** | .250** | .178* | .269** | .246** | 1 | .233** | .282** |
.000 | .003 | .035 | .001 | .003 | .006 | .001 | |
139 | 140 | 140 | 140 | 140 | 140 | 140 | 140 |
.386** | .113 | .204* | .238** | .218** | .233** | 1 | .368** |
.000 | .184 | .016 | .005 | .010 | .006 | .000 | |
139 | 140 | 140 | 140 | 140 | 140 | 140 | 140 |
.402** | .248** | .264** | .186* | .285** | .282** | .368** | 1 |
.000 | .003 | .002 | .028 | .001 | .001 | .000 | |
139 | 140 | 140 | 140 | 140 | 140 | 140 | 140 |
**. Correlation is significant at the 0.01 level (2-tailed).
*. Correlation is significant at the 0.05 level (2-tailed).
5. Hồi quy tuyến tính
Variables Entered/Removeda
Variables Entered | Variables Removed | Method | |
1 | CCQ, TH, GC, THQ, CLSP, SDUb | . | Enter |
a. Dependent Variable: QDSD
b. All requested variables entered.
Model Summaryb
R | R Square | Adjusted R Square | Std. Error of the Estimate | Durbin- Watson | |
1 | .723a | .523 | .501 | .43703 | 2.189 |
a. Predictors: (Constant), CCQ, TH, GC, THQ, CLSP, SDU
b. Dependent Variable: QDSD
ANOVAa
Sum of Squares | df | Mean Square | F | Sig. | ||
Regression | 27.610 | 6 | 4.602 | 24.093 | .000b | |
1 | Residual | 25.211 | 132 | .191 | ||
Total | 52.822 | 138 |
a. Dependent Variable: QDSD
b. Predictors: (Constant), CCQ, TH, GC, THQ, CLSP, SDU
Coefficientsa
Unstandardized Coefficients | Standardized Coefficients | t | Sig. | Collinearity Statistics | ||||
B | Std. Error | Beta | Tolerance | VIF | ||||
(Constant) | -.139 | .352 | -.394 | .694 | ||||
TH | .189 | .075 | .173 | 2.526 | .013 | .772 | 1.295 | |
GC | .230 | .065 | .236 | 3.530 | .001 | .810 | 1.235 | |
1 | CLSP | .079 | .058 | .092 | 1.363 | .175 | .792 | 1.263 |
SDU | .224 | .059 | .257 | 3.799 | .000 | .791 | 1.264 | |
THQ | .155 | .047 | .215 | 3.299 | .001 | .850 | 1.176 | |
CCQ | .146 | .049 | .190 | 2.964 | .004 | .883 | 1.132 |
a. Dependent Variable: QDSD
Collinearity Diagnosticsa
Dimension | Eigenvalue | Condition Index | Variance Proportions | |||||||
(Constant) | TH | GC | CLSP | SDU | THQ | CCQ | ||||
1 | 6.870 | 1.000 | .00 | .00 | .00 | .00 | .00 | .00 | .00 | |
2 | .034 | 14.261 | .00 | .00 | .05 | .02 | .02 | .94 | .01 | |
3 | .031 | 14.862 | .00 | .04 | .02 | .02 | .03 | .00 | .90 | |
1 | 4 | .024 | 16.919 | .00 | .00 | .00 | .68 | .36 | .00 | .00 |
5 | .018 | 19.619 | .03 | .01 | .49 | .25 | .45 | .01 | .00 | |
6 | .015 | 21.489 | .07 | .52 | .36 | .03 | .13 | .05 | .00 | |
7 | .009 | 28.186 | .89 | .43 | .08 | .00 | .00 | .00 | .08 |
a. Dependent Variable: QDSD
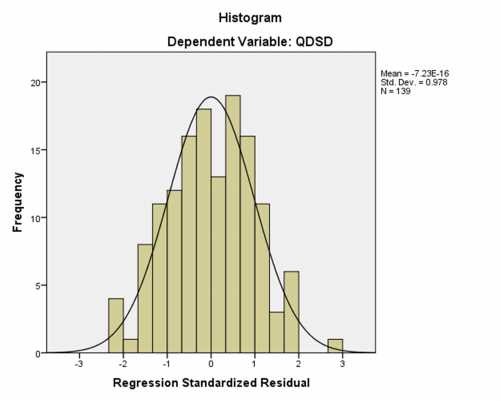
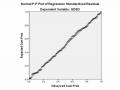
Residuals Statisticsa
Minimum | Maximum | Mean | Std. Deviation | N | |
Predicted Value | 2.3941 | 4.8016 | 3.9335 | .44730 | 139 |
Residual | -1.00236 | 1.19037 | .00000 | .42742 | 139 |
Std. Predicted Value | -3.441 | 1.941 | .000 | 1.000 | 139 |
Std. Residual | -2.294 | 2.724 | .000 | .978 | 139 |
a. Dependent Variable: QDSD