> TukeyHSD(d)
Tukey multiple comparisons of means 95% family-wise confidence level
Fit: aov(formula = DelD ~ Vung, data = Keo2)
diff | lwr | upr p adj | |
III-II | -1.7345043 | -1.94225056 | -1.5267581 0.0000000 |
IV-II | -0.9196416 | -1.10281777 | -0.7364655 0.0000000 |
V-II | -1.4826716 | -1.68238787 | -1.2829554 0.0000000 |
IV-III | 0.8148627 | 0.67352345 | 0.9562020 0.0000000 |
V-III | 0.2518327 | 0.08962954 | 0.4140358 0.0003977 |
V-IV | -0.5630300 | -0.69227729 | -0.4337827 0.0000000 |
Có thể bạn quan tâm!
-

 Nghiên cứu bổ sung cơ sở khoa học về kỹ thuật trồng rừng phòng hộ trên các dạng lập địa chính vùng cát ven biển các tỉnh Hà Tĩnh, Quảng Bình và Quảng Trị - 20
 -
 Nghiên cứu bổ sung cơ sở khoa học về kỹ thuật trồng rừng phòng hộ trên các dạng lập địa chính vùng cát ven biển các tỉnh Hà Tĩnh, Quảng Bình và Quảng Trị - 21
 -
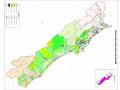 Phân Bố Diện Tích Các Loại Đất Cát Theo Độ Cao Và Theo Đơn Vị Hành Chính Huyện, Thành Phố Khu Vực Nghiên Cứu
 -
 Nghiên cứu bổ sung cơ sở khoa học về kỹ thuật trồng rừng phòng hộ trên các dạng lập địa chính vùng cát ven biển các tỉnh Hà Tĩnh, Quảng Bình và Quảng Trị - 24
 -
 Nghiên cứu bổ sung cơ sở khoa học về kỹ thuật trồng rừng phòng hộ trên các dạng lập địa chính vùng cát ven biển các tỉnh Hà Tĩnh, Quảng Bình và Quảng Trị - 25
Xem toàn bộ 207 trang tài liệu này.

> d1=LSD.test(d,"Vung")
> d1
$statistics
MSerror Df Mean CV 0.5746206 1450 1.438968 52.67922
$parameters
test p.ajusted name.t ntr alpha Fisher-LSD none Vung 4 0.05
$means
DelD std r LCL UCL Min Max Q25 Q50 Q75
2.0475 2.390 | 2.93 | |
III 0.8111673 0.2652125 257 0.7184129 0.9039218 0.33 1.55 | 0.6300 0.800 | 1.00 |
IV 1.6260300 0.9704864 733 1.5711076 1.6809524 0.25 5.43 | 0.8800 1.210 | 2.36 |
V 1.0630000 0.3310540 330 0.9811452 1.1448548 0.40 2.35 $groups | 0.8200 1.035 | 1.26 |
DelD groups II 2.5456716 a
IV 1.6260300 b
V 1.0630000 c
III 0.8111673 d
attr(,"class")
[1] "group"
> h=aov(DelH~Vung,data=Keo2)
> summary(h)
Df Sum Sq Mean Sq F value Pr(>F)
Vung 3 32.51 10.838 116.8 <2e-16 ***
Residuals 1450 134.56 0.093
---
Signif. codes: 0 ‘***’ 0.001 ‘**’ 0.01 ‘*’ 0.05 ‘.’ 0.1 ‘ ’ 1
> TukeyHSD(h)
Tukey multiple comparisons of means 95% family-wise confidence level
Fit: aov(formula = DelH ~ Vung, data = Keo2)
diff lwr | upr p adj | |
III-II | -0.1902506 -0.2737366 | -0.10676462 0.0000000 |
IV-II | -0.3083483 -0.3819604 | -0.23473622 0.0000000 |
V-II | 0.0406730 -0.0395860 | 0.12093200 0.5608599 |
IV-III | -0.1180977 -0.1748971 | -0.06129841 0.0000006 |
V-III | 0.2309236 0.1657398 | 0.29610739 0.0000000 |
V-IV | 0.3490213 0.2970813 | 0.40096132 0.0000000 |
> h1=LSD.test(h,"Vung")
> h1
$statistics
MSerror Df Mean CV 0.09279871 1450 0.821575 37.07864
$parameters
test p.ajusted name.t ntr alpha Fisher-LSD none Vung 4 0.05
$means
DelH std r LCL UCL Min Max Q25 Q50 Q75 II 1.0014179 0.3366222 134 0.9497966 1.0530393 0.40 2.00 0.7000 0.985 1.245
III 0.8111673 0.2652125 257 0.7738925 0.8484421 0.33 1.55 0.6300 0.800 1.000
IV 0.6930696 0.3217180 733 0.6709982 0.7151410 0.15 1.92 0.4300 0.670 0.920
V 1.0420909 0.2795842 330 1.0091963 1.0749855 0.40 1.75 0.8225 1.050 1.250
$groups
DelH groups V 1.0420909 a
II 1.0014179 a
III 0.8111673 b
IV 0.6930696 c
attr(,"class")
[1] "group"
> dt=aov(DelDt~Vung,data=Keo2)
> summary(dt)
Df Sum Sq Mean Sq F value Pr(>F)
Vung 3 19.44 6.479 31.33 <2e-16 ***
Residuals 1450 299.85 0.207
---
Signif. codes: 0 ‘***’ 0.001 ‘**’ 0.01 ‘*’ 0.05 ‘.’ 0.1 ‘ ’ 1
> TukeyHSD(dt)
Tukey multiple comparisons of means 95% family-wise confidence level
Fit: aov(formula = DelDt ~ Vung, data = Keo2)
diff | lwr | upr | p adj | |
III-II | -0.05463471 | -0.17926110 | 0.06999169 | 0.6725478 |
IV-II | -0.24171642 | -0.35160328 | -0.13182956 | 0.0000001 |
V-II | 0.01104116 | -0.10876806 | 0.13085038 | 0.9953143 |
IV-III | -0.18708171 | -0.27187074 | -0.10229268 | 0.0000001 |
V-III | 0.06567586 | -0.03162935 | 0.16298108 | 0.3053474 |
V-IV | 0.25275758 | 0.17522249 | 0.33029266 | 0.0000000 |
> dt1=LSD.test(dt,"Vung")
> dt1
$statistics
MSerror Df Mean CV 0.2067926 1450 0.9427098 48.23802
$parameters
test p.ajusted name.t ntr alpha Fisher-LSD none Vung 4 0.05
DelDt | std | r LCL UCL Min Max | Q25 Q50 Q75 |
II 1.071716 | 0.3287171 | 134 0.9946570 1.1487759 0.50 2.20 | 0.85 1.000 1.25 |
III 1.017082 | 0.2186367 | 257 0.9614386 1.0727249 0.45 1.83 | 0.86 1.010 1.15 |
IV 0.830000 | 0.5381744 | 733 0.7970522 0.8629478 0.10 3.21 | 0.41 0.680 1.15 |
V 1.082758 | 0.4314047 | 330 1.0336531 1.1318621 0.10 1.90 | 0.88 1.175 1.40 |
$groups
DelDt groups
V 1.082758 a
II 1.071716 a
III 1.017082 a
IV 0.830000 b
attr(,"class")
[1] "group"
II. KẾT QUẢ PHI LAO TRÊN DẠNG LẬP ĐỊA B
2.1. Giai đoạn 14 tháng tuổi
> d=aov(Dgoc~CTTN,data=TP14)
> summary(d)
Df Sum Sq Mean Sq F value Pr(>F) CTTN 3 4.470 1.4901 16.38 3.43e-08 ***
Residuals 71 6.457 0.0909
---
Signif. codes: 0 ‘***’ 0.001 ‘**’ 0.01 ‘*’ 0.05 ‘.’ 0.1 ‘ ’ 1
22 observations deleted due to missingness
> d1=LSD.test(d,"CTTN")
> d1
$statistics
MSerror Df Mean CV 0.09094891 71 1.7512 17.22118
$parameters
p.ajusted none | name.t ntr alpha CTTN 4 0.05 | ||
$means Dgoc | std | r LCL UCL Min Max Q25 Q50 | Q75 |
CT1 1.548889 | 0.3257470 | 9 1.3484462 1.749332 1.08 2.01 1.31 1.40 | 1.780 |
CT2 1.820000 | 0.2796855 | 26 1.7020698 1.937930 1.37 2.61 1.69 1.75 | 1.955 |
CT3 1.921935 | 0.3344689 | 31 1.8139338 2.029937 1.27 2.51 1.72 1.91 | 2.195 |
DC 1.166667 | 0.1926136 | 9 0.9662239 1.367109 1.02 1.53 1.02 1.11 | 1.150 |
$groups Dgoc | groups | ||
CT3 1.921935 CT2 1.820000 CT1 1.548889 DC 1.166667 | a a b c |
attr(,"class")
[1] "group"
> h=aov(Hvn_m~CTTN,data=TP14)
> summary(h)
Df Sum Sq Mean Sq F value Pr(>F) CTTN 3 2.217 0.7391 8.395 7.52e-05 ***
Residuals 71 6.251 0.0880
---
Signif. codes: 0 ‘***’ 0.001 ‘**’ 0.01 ‘*’ 0.05 ‘.’ 0.1 ‘ ’ 1
22 observations deleted due to missingness
> h1=LSD.test(h,"CTTN")
> h1
$statistics
MSerror Df Mean CV 0.08803982 71 1.257333 23.59876
$parameters
test p.ajusted name.t ntr alpha Fisher-LSD none CTTN 4 0.05
std r LCL UCL Min Max Q25 | Q50 | Q75 | |
CT1 1.0644444 | 0.2867103 9 0.8672334 1.261655 0.60 1.50 0.9000 | 1.10 | 1.16 |
CT2 1.2842308 | 0.2936007 26 1.1682020 1.400260 0.43 1.76 1.1325 | 1.27 | 1.48 |
CT3 1.3987097 | 0.3229008 31 1.2924493 1.504970 0.57 1.87 1.1750 | 1.44 | 1.65 |
DC 0.8855556 | 0.1969207 9 0.6883446 1.082767 0.70 1.30 0.7700 | 0.80 | 0.94 |
$groups Hvn_m | groups | ||
CT3 1.3987097 CT2 1.2842308 CT1 1.0644444 DC 0.8855556 | a ab bc c |
attr(,"class")
[1] "group"
> dt=aov(Dtan_tb~CTTN,data=TP14)
> summary(dt)
Df Sum Sq Mean Sq F value Pr(>F) CTTN 3 0.942 0.31398 11.49 3.15e-06 ***
Residuals 71 1.940 0.02732
---
Signif. codes: 0 ‘***’ 0.001 ‘**’ 0.01 ‘*’ 0.05 ‘.’ 0.1 ‘ ’ 1
22 observations deleted due to missingness
> dt1=LSD.test(dt)
> dt1
Linear mixed model fit by REML ['lmerMod'] Formula: DelDt ~ (1 | Dong)
Data: DelDt1
REML criterion at convergence: 458.2522 Random effects:
Groups Name Std.Dev. Dong (Intercept) 0.0000
Residual 0.3259
Number of obs: 759, groups: Dong, 20 Fixed Effects:
(Intercept)
0.4456
convergence code 0; 0 optimizer warnings; 1 lme4 warnings
> dt1=LSD.test(dt,"CTTN")
> dt1
$statistics
MSerror Df Mean CV 0.02732181 71 0.658 25.12053
$parameters
test p.ajusted name.t ntr alpha Fisher-LSD none CTTN 4 0.05
$means
Dtan_tb std r LCL UCL Min Max Q25 Q50 Q75 CT1 0.5788889 0.2281143 9 0.4690272 0.6887506 0.23 0.90 0.4000 0.63 0.70
CT2 0.6792308 0.1214882 26 0.6145938 0.7438677 0.45 0.88 0.5625 0.69 0.75
CT3 0.7416129 0.1831411 31 0.6824177 0.8008081 0.35 1.00 0.6000 0.80 0.88
DC 0.3877778 0.1361780 9 0.2779161 0.4976395 0.25 0.63 0.3000 0.35 0.48
$groups
Dtan_tb groups CT3 0.7416129 a
CT2 0.6792308 ab
CT1 0.5788889 b
DC 0.3877778 c
attr(,"class")
[1] "group"
> c=aov(Bough_50cm~CTTN,data=TP14)
> s=aov(Song_chet~CTTN,data=TP14)
> summary(s)
Df Sum Sq Mean Sq F value Pr(>F)
CTTN 3 3.217 1.0724 7.23 0.000205 ***
Residuals 93 13.793 0.1483
---
Signif. codes: 0 ‘***’ 0.001 ‘**’ 0.01 ‘*’ 0.05 ‘.’ 0.1 ‘ ’ 1
> s1=LSD.test(s,"CTTN")
> s1
$statistics
MSerror Df Mean CV 0.1483143 93 0.7731959 49.80832
$parameters
test p.ajusted name.t ntr alpha Fisher-LSD none CTTN 4 0.05
$means
Song_chet std r LCL UCL Min Max Q25 Q50 Q75 CT1 1.0000000 0.0000000 9 0.7450787 1.2549213 1 1 1 1 1
0.0000000 26 0.8500175 1.1499825 1 | 1 | 1 | 1 | 1 | |
CT3 0.6078431 | 0.4930895 51 0.5007548 0.7149315 0 | 1 | 0 | 1 | 1 |
DC 0.8181818 | 0.4045199 11 0.5875968 1.0487668 0 | 1 | 1 | 1 | 1 |
$groups Song_chet | groups | ||||
CT1 1.0000000 CT2 1.0000000 DC 0.8181818 CT3 0.6078431 | a a ab b | ||||
attr(,"class") | |||||
2.2. Giai đoạn 24 tháng tuổi
> summary(d)
Df Sum Sq Mean Sq F value Pr(>F)
CTTN 3 18.79 6.263 36.88 <2e-16 ***
Residuals 113 19.19 0.170
---
Signif. codes: 0 ‘***’ 0.001 ‘**’ 0.01 ‘*’ 0.05 ‘.’ 0.1 ‘ ’ 1
> d1=LSD.test(d,"CTTN")
> d1
$statistics
MSerror Df Mean CV 0.1698261 113 1.802222 22.86619
$parameters
test p.ajusted name.t ntr alpha Fisher-LSD none CTTN 4 0.05
$means
Dgoc std r LCL UCL Min Max Q25 Q50 Q75
0.4830953 | 29 1.8794247 2.182644 1.02 3.09 1.7500 2.01 | 2.26 | |
CT2 1.846190 | 0.4290044 | 21 1.6680279 2.024353 1.08 2.67 1.5000 1.85 | 2.01 |
CT3 2.011915 | 0.4343543 | 47 1.8928244 2.131005 1.27 3.50 1.7350 1.97 | 2.29 |
DC 0.931500 | 0.1248694 | 20 0.7489377 1.114062 0.64 1.15 0.8825 0.95 | 1.02 |
$groups Dgoc | groups | ||
CT1 2.031034 CT3 2.011915 CT2 1.846190 | a a a |
DC 0.931500 b
attr(,"class")
[1] "group"
> h=aov(Hvn~CTTN,data=PLTP)
> h=aov(Hvn_m~CTTN,data=PLTP)
> summary(h)
Df Sum Sq Mean Sq F value Pr(>F) CTTN 3 7.295 2.4316 18.03 1.24e-09 ***
Residuals 113 15.237 0.1348
---
Signif. codes: 0 ‘***’ 0.001 ‘**’ 0.01 ‘*’ 0.05 ‘.’ 0.1 ‘ ’ 1
> h1=LSD.test(h,"CTTN")
> h1
$statistics
MSerror Df Mean CV 0.1348376 113 1.25547 29.2482
$parameters
test p.ajusted name.t ntr alpha Fisher-LSD none CTTN 4 0.05
$means
Hvn_m std r LCL UCL Min Max Q25 Q50 Q75
2.40 1.1000 1.35 1.6500 | |
CT2 1.345238 0.3272861 21 1.1864859 1.5039903 0.85 | 1.95 1.1000 1.32 1.5000 |
CT3 1.361277 0.3605408 47 1.2551607 1.4673925 0.52 | 2.10 1.0750 1.30 1.5800 |
DC 0.707000 0.2071892 20 0.5443274 0.8696726 0.40 $groups | 1.25 0.5575 0.70 0.8125 |
Hvn_m groups CT1 1.397241 a
CT3 1.361277 a
CT2 1.345238 a
DC 0.707000 b
attr(,"class")
[1] "group"
> dt=aov(Dtan_tb~CTTN,data=PLTP)
> summary(dt)
Df Sum Sq Mean Sq F value Pr(>F)
CTTN 3 7.166 2.3885 35.96 <2e-16 ***
Residuals 113 7.506 0.0664
---
Signif. codes: 0 ‘***’ 0.001 ‘**’ 0.01 ‘*’ 0.05 ‘.’ 0.1 ‘ ’ 1
> dt1=LSD.test(dt,"CTTN")
> dt1
$statistics
MSerror Df Mean CV 0.06642651 113 1.012051 25.46644
$parameters
test p.ajusted name.t ntr alpha Fisher-LSD none CTTN 4 0.05
$means
std | r LCL UCL Min Max Q25 Q50 Q75 | |
CT1 1.153793 | 0.3228712 | 29 1.0589740 1.2486122 0.65 1.98 0.950 1.13 1.300 |
CT2 1.016667 | 0.2238377 | 21 0.9052410 1.1280923 0.50 1.45 0.940 1.03 1.180 |
CT3 1.149574 | 0.2697016 | 47 1.0750934 1.2240555 0.65 1.73 0.975 1.11 1.365 |
DC 0.478500 | 0.1122157 | 20 0.3643227 0.5926773 0.30 0.65 0.380 0.50 0.580 |
$groups Dtan_tb | groups | |
CT1 1.153793 CT3 1.149574 CT2 1.016667 | a a a |
DC 0.478500 b
attr(,"class")
[1] "group"
> c=aov(Bough_50cm~CTTN,data=PLTP)
> summary(c)
Df Sum Sq Mean Sq F value Pr(>F) CTTN 3 513.4 171.14 14.04 7.63e-08 ***
Residuals 113 1377.1 12.19
---
Signif. codes: 0 ‘***’ 0.001 ‘**’ 0.01 ‘*’ 0.05 ‘.’ 0.1 ‘ ’ 1
> c1=LSD.test(c,"CTTN")
> c1
$statistics
MSerror Df Mean CV 12.18672 113 10.70085 32.62309
$parameters
test p.ajusted name.t ntr alpha Fisher-LSD none CTTN 4 0.05
$means
std | r | LCL UCL Min Max Q25 Q50 Q75 | |
CT1 11.20690 | 4.34560 | 29 | 9.922591 12.491203 5 20 8 10 14 |
CT2 10.47619 | 2.78602 | 21 | 8.966952 11.985429 6 16 9 10 12 |
CT3 12.34043 | 3.55868 | 47 | 11.331594 13.349257 7 23 9 12 14 |
DC 6.35000 | 2.41214 | 20 | 4.803491 7.896509 2 12 5 6 8 |
$groups
Bough_50cm groups CT3 12.34043 a
CT1 11.20690 ab
CT2 10.47619 b
DC 6.35000 c
attr(,"class")
[1] "group"
> s=aov(Song_chet~CTTN,data=PLTP)
> summary(s)
Df Sum Sq Mean Sq F value Pr(>F)
CTTN 3 2.17 0.7229 4.282 0.00573 **
Residuals 244 41.19 0.1688
---
Signif. codes: 0 ‘***’ 0.001 ‘**’ 0.01 ‘*’ 0.05 ‘.’ 0.1 ‘ ’ 1
> s1=LSD.test(s,"CTTN")
> s1
$statistics
MSerror Df Mean CV 0.168796 244 0.7741935 53.06786
$parameters
test p.ajusted name.t ntr alpha Fisher-LSD none CTTN 4 0.05
$means
std | r LCL UCL Min Max Q25 Q50 Q75 | |
CT1 0.7037037 | 0.4609109 | 54 0.5935772 0.8138302 0 1 0 1 1 |
CT2 0.9591837 | 0.1999149 | 49 0.8435749 1.0747924 0 1 1 1 1 |
CT3 0.7289720 | 0.4465823 | 107 0.6507377 0.8072062 0 1 0 1 1 |
DC 0.7631579 | 0.4308515 | 38 0.6318784 0.8944374 0 1 1 1 1 |
$groups Song_chet | groups | |
CT2 0.9591837 DC 0.7631579 | a b |
CT3 0.7289720 b
CT1 0.7037037 b
attr(,"class")
[1] "group"
2.3. KEO LÁ LIỀM LẬP ĐỊA B VÀ C1
> library(agricolae)
> d=aov(dg~Lapdia,data=KL)
> summary(d)
Df Sum Sq Mean Sq F value Pr(>F) Lapdia 1 29.49 29.486 24.47 1.86e-06 ***
Residuals 164 197.63 1.205
---
Signif. codes: 0 ‘***’ 0.001 ‘**’ 0.01 ‘*’ 0.05 ‘.’ 0.1 ‘ ’ 1
8 observations deleted due to missingness
> d=LSD.test(d,"Lapdia")
> d
$statistics
MSerror Df Mean CV 1.205073 164 4.213855 26.05116
$parameters
test p.ajusted name.t ntr alpha Fisher-LSD none Lapdia 2 0.05
$means
dg std r LCL UCL Min Max Q25 Q50 Q75 B 3.845000 1.033559 94 3.621433 4.068567 1.66 6.62 3.12 3.675 4.5725
C1 4.695417 1.176562 72 4.439967 4.950866 2.16 7.83 3.82 4.620 5.4100
$groups
dg groups
C1 4.695417 a
B 3.845000 b
attr(,"class")
[1] "group"
> h=aov(hvn~Lapdia,data=KL)
> summary(h)
Df Sum Sq Mean Sq F value Pr(>F) Lapdia 1 8.98 8.979 32.34 5.81e-08 ***
Residuals 164 45.54 0.278
---
Signif. codes: 0 ‘***’ 0.001 ‘**’ 0.01 ‘*’ 0.05 ‘.’ 0.1 ‘ ’ 1
8 observations deleted due to missingness
> h1=LSD.test(h,"Lapdia")
> h1
$statistics
MSerror Df Mean CV 0.2776672 164 1.651205 31.91254
$parameters
test p.ajusted name.t ntr alpha Fisher-LSD none Lapdia 2 0.05
$means
hvn std r LCL UCL Min Max Q25 Q50 Q75 B 1.447660 0.4841341 94 1.340344 1.554975 0.75 3.0 1.0500 1.35 1.800
C1 1.916944 0.5782383 72 1.794325 2.039564 0.65 3.1 1.4375 1.85 2.325
$groups
hvn groups