
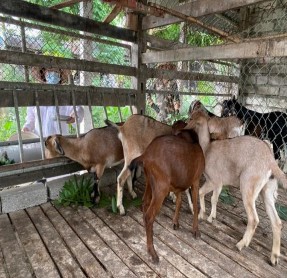
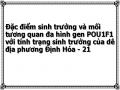
Ảnh 24. Dê thí nghiệm |
Có thể bạn quan tâm!
-
 Tiêu Tốn Và Chi Phí Thức Ăn/kg Tăng Khối Lượng Của Dê Thí Nghiệm
 -
 Đặc điểm sinh trưởng và mối tương quan đa hình gen POU1F1 với tính trạng sinh trưởng của dê địa phương Định Hóa - 16
 -
 Một Số Hình Ảnh Của Trong Quá Trình Thực Hiện Đề Tài Phụ Lục 2: Kết Quả Xử Lý Số Liệu Của Đề Tài
 -
 Sinh Trưởng Tuyệt Đối Của Dê Định Hóa
 -
 Đặc điểm sinh trưởng và mối tương quan đa hình gen POU1F1 với tính trạng sinh trưởng của dê địa phương Định Hóa - 20
 -
 Sinh Trưởng Tương Đối Của Dê Định Hóa
Xem toàn bộ 306 trang tài liệu này.
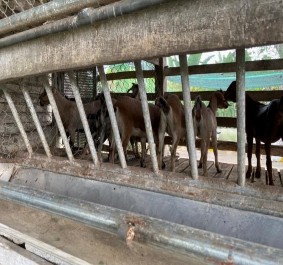

Ảnh 26. Dê thí nghiệm được tách riêng đực, cái |
PHỤ LỤC 2
KẾT QUẢ XỬ LÝ SỐ LIỆU CỦA ĐỀ TÀI
1. KẾT QUẢ XỬ LÝ NỘI DUNG 1
1.1 SINH TRƯỞNG TÍCH LŨY CỦA DÊ ĐỊNH HÓA
Descriptive Statistics: SS, 1TT, 2TT, 3TT, 4TT, 5TT, 6TT, 7TT, 8TT, 9TT, 10TT, 11TT, 12TT
N | N* | Mean | SE Mean | StDev | Variance | CoefVar | Minimum | Maximum | |
SS | 60 | 0 | 1.7167 | 0.0255 | 0.1976 | 0.0390 | 11.51 | 1.4000 | 2.1000 |
1TT | 60 | 0 | 3.5683 | 0.0499 | 0.3869 | 0.1497 | 10.84 | 2.8000 | 4.5000 |
2TT | 60 | 0 | 5.1150 | 0.0599 | 0.4639 | 0.2152 | 9.07 | 4.2000 | 6.2000 |
3TT | 60 | 0 | 6.5850 | 0.0726 | 0.5623 | 0.3162 | 8.54 | 5.5000 | 7.8000 |
4TT | 60 | 0 | 8.0017 | 0.0824 | 0.6385 | 0.4076 | 7.98 | 6.5000 | 9.6000 |
5TT | 60 | 0 | 9.4667 | 0.0851 | 0.6594 | 0.4348 | 6.97 | 7.9000 | 11.5000 |
6TT | 60 | 0 | 10.788 | 0.108 | 0.835 | 0.698 | 7.74 | 9.000 | 12.800 |
7TT | 60 | 0 | 12.177 | 0.132 | 1.021 | 1.042 | 8.39 | 9.700 | 14.500 |
8TT | 60 | 0 | 13.483 | 0.136 | 1.057 | 1.117 | 7.84 | 11.700 | 15.800 |
9TT | 60 | 0 | 14.890 | 0.142 | 1.100 | 1.211 | 7.39 | 12.900 | 17.700 |
10TT | 52 | 0 | 16.225 | 0.148 | 1.146 | 1.313 | 7.06 | 14.300 | 19.800 |
11TT | 52 | 0 | 17.522 | 0.168 | 1.305 | 1.702 | 7.45 | 15.100 | 21.200 |
12TT | 52 | 0 | 19.117 | 0.238 | 1.842 | 3.395 | 9.64 | 16.100 | 23.500 |
SINH TRƯỞNG TÍCH LŨY THEO TÍNH BIỆT (D: đực; C: cái)
One-way ANOVA: SS versus Tinh biet
Method
Null hypothesis All means are equal Alternative hypothesis At least one mean is different Significance level α = 0.05
Equal variances were assumed for the analysis. Factor Information
Factor Levels Values TT 2 C, D
Analysis of Variance
Source DF Adj SS Adj MS F-Value P-Value TT 1 0.5607 0.56067 18.66 0.000
Error 58 1.7427 0.03005
Total 59 2.3033 Model Summary
R-sq R-sq(adj) | R-sq(pred) | |
0.173338 | 24.34% 23.04% | 19.03% |
TT N | Mean | StDev | 95% | CI |
C 30 | 1.6200 | 0.1710 | (1.5567, | 1.6833) |
D 30 | 1.8133 | 0.1756 | (1.7500, | 1.8767) |
Pooled | StDev = | 0.173338 |
Tukey Pairwise Comparisons
Grouping Information Using the Tukey Method and 95% Confidence
TT N Mean Grouping D 30 1.8133 A
C 30 1.6200 B
Means that do not share a letter are significantly different
Tukey Simultaneous 95% CIs
One-way ANOVA: 1TT versus Tinh biet
Method
Null hypothesis All means are equal Alternative hypothesis At least one mean is different Significance level α = 0.05
Equal variances were assumed for the analysis.
Factor Information
Factor Levels Values TT 2 C, D
Analysis of Variance
Source DF Adj SS Adj MS F-Value P-Value TT 1 3.313 3.31350 34.84 0.000
Error 58 5.516 0.09511
Total 59 8.830
Model Summary
R-sq 37.53% | R-sq(adj) 36.45% | R-sq(pred) 33.14% | |
TT N | Mean | StDev | 95% CI |
C | 30 | 3.3333 | 0.2537 (3.2206, 3.4460) |
D | 30 | 3.8033 | 0.3548 (3.6906, 3.9160) |
Pooled StDev = 0.308398
Tukey Pairwise Comparisons
Grouping Information Using the Tukey Method and 95% Confidence TT N Mean Grouping
D 30 3.8033 A
C 30 3.3333 B
Means that do not share a letter are significantly different.
Tukey Simultaneous 95% CIs
One-way ANOVA: 2TT versus Tinh biet
Method
Null hypothesis All means are equal Alternative hypothesis At least one mean is different Significance level α = 0.05
Equal variances were assumed for the analysis.
Factor Information
Factor Levels Values TT 2 C, D
Analysis of Variance
Source DF Adj SS Adj MS F-Value P-Value TT 1 6.208 6.2082 55.50 0.000
Error 58 6.488 0.1119
Total 59 12.696
Model Summary
R-sq 48.90% | R-sq(adj) 48.02% | R-sq(pred) 45.31% | |
TT N | Mean | StDev | 95% CI |
C 30 | 4.7933 | 0.2716 (4.6711, 4.9156) | |
D 30 | 5.4367 | 0.3873 (5.3144, 5.5589) | |
Pooled StDev = 0.334466
Tukey Pairwise Comparisons
Grouping Information Using the Tukey Method and 95% Confidence TT N Mean Grouping
D 30 5.4367 A
C 30 4.7933 B
Means that do not share a letter are significantly different.
Tukey Simultaneous 95% CIs
One-way ANOVA: 3TT versus Tinh biet
Method
Null hypothesis All means are equal Alternative hypothesis At least one mean is different Significance level α = 0.05
Equal variances were assumed for the analysis.
Factor Information
Factor Levels Values TT 2 C, D
Analysis of Variance
Source DF Adj SS Adj MS F-Value P-Value TT 1 9.048 9.0482 54.62 0.000
Error 58 9.608 0.1657
Total 59 18.656
Model Summary
R-sq 48.50% | R-sq(adj) 47.61% | R-sq(pred) 44.89% | |
TT N | Mean | StDev | 95% CI |
C 30 | 6.1967 | 0.3810 (6.0479, 6.3454) | |
D 30 | 6.9733 | 0.4315 (6.8246, 7.1221) | |
Pooled StDev = 0.407015
Tukey Pairwise Comparisons
Grouping Information Using the Tukey Method and 95% Confidence TT N Mean Grouping
D 30 6.9733 A
C 30 6.1967 B
Means that do not share a letter are significantly different.
One-way ANOVA: 4TT versus Tinh biet
Method
Null hypothesis All means are equal Alternative hypothesis At least one mean is different Significance level α = 0.05
Equal variances were assumed for the analysis.
Factor Information
Factor Levels Values TT 2 C, D
Analysis of Variance
Source DF Adj SS Adj MS F-Value P-Value TT 1 9.842 9.8415 40.17 0.000
Error 58 14.208 0.2450
Total 59 24.050
Model Summary
R-sq 40.92% | R-sq(adj) 39.90% | R-sq(pred) 36.78% | |
TT N | Mean | StDev | 95% CI |
C 30 | 7.5967 | 0.4390 (7.4158, 7.7776) | |
D 30 | 8.4067 | 0.5452 (8.2258, 8.5876) | |
Pooled StDev = 0.494946
Tukey Pairwise Comparisons
Grouping Information Using the Tukey Method and 95% Confidence TT N Mean Grouping
D 30 8.4067 A
C 30 7.5967 B
Means that do not share a letter are significantly different.
One-way ANOVA: 5TT versus Tinh biet
Method
Null hypothesis All means are equal Alternative hypothesis At least one mean is different Significance level α = 0.05
Equal variances were assumed for the analysis.
Factor Information
Factor Levels Values TT 2 C, D
Analysis of Variance
Source DF Adj SS Adj MS F-Value P-Value TT 1 9.126 9.1260 32.03 0.000
Error 58 16.527 0.2850
Total 59 25.653
Model Summary
R-sq 35.57% | R-sq(adj) 34.46% | R-sq(pred) 31.05% | |
TT N | Mean | StDev | 95% CI |
C 30 | 9.0767 | 0.4826 (8.8816, 9.2718) | |
D 30 | 9.857 | 0.581 ( 9.662, 10.052) | |
Pooled StDev = 0.533811
Tukey Pairwise Comparisons
Grouping Information Using the Tukey Method and 95% Confidence
N | Mean Grouping | |
D | 30 | 9.857 A |
C | 30 | 9.0767 B |
Means that do not share a letter are significantly different.
One-way ANOVA: 6TT versus Tinh biet
Method
Null hypothesis All means are equal Alternative hypothesis At least one mean is different Significance level α = 0.05
Equal variances were assumed for the analysis.
Factor Information
Factor Levels Values TT 2 C, D
Analysis of Variance
Source DF Adj SS Adj MS F-Value P-Value TT 1 20.53 20.5335 57.73 0.000
Error 58 20.63 0.3557
Total 59 41.16
Model Summary
R-sq | R-sq(adj) | R-sq(pred) | |
0.596373 | 49.88% | 49.02% | 46.37% |
TT N | Mean | StDev 95% CI |
C 30 | 10.2033 | 0.5275 (9.9854, 10.4213) |
D 30 | 11.373 | 0.658 (11.155, 11.591) |
Pooled StDev = 0.596373
Tukey Pairwise Comparisons
Grouping Information Using the Tukey Method and 95% Confidence
N | Mean Grouping | |
D | 30 | 11.373 A |
C | 30 | 10.2033 B |
Means that do not share a letter are significantly different.