Ý ĐỊNH
Scale Mean if Item Deleted | Scale Variance if Item Deleted | Corrected Item- Total Correlation | Cronbach's Alpha if Item Deleted | |
YD1 | 11.90 | 3.217 | .603 | .771 |
YD2 | 12.07 | 3.241 | .655 | .749 |
YD3 | 12.15 | 2.846 | .715 | .715 |
YD4 | 12.23 | 3.282 | .540 | .802 |
Có thể bạn quan tâm!
-

 Định Hướng Và Giải Pháp Nhằm Nâng Cao Ý Định Đặt Phòng Của Khách Hàng Qua Booking.com Tại Khách Sạn Thanh Xuân Huế.
 -
 Hair Và Cộng Sự (2014), Multivariate Data Analysis 7Th Pearson Prentice Hall, Upper Saddle River, Nj.
 -
 Các nhân tố ảnh hưởng đến ý định đặt phòng của khách hàng qua Booking.com tại khách sạn Thanh Xuân Huế - 14
 -
 Các nhân tố ảnh hưởng đến ý định đặt phòng của khách hàng qua Booking.com tại khách sạn Thanh Xuân Huế - 16
Xem toàn bộ 128 trang tài liệu này.
3. Phân tích nhân tố khám phá EFA Phân tích nhân tố biến độc lập
KMO and Bartlett's Test
.810 | |
Approx. Chi-Square | 1204.722 |
Bartlett's Test of Sphericity df | 171 |
Sig. | .000 |
Ma trận nhân tố
Initial Eigenvalues | Extraction Sums of Squared Loadings | Rotation Sums of Squared Loadings | |||||||
Total | % of Variance | Cumulative % | Total | % of Variance | Cumulative % | Total | % of Variance | Cumulative % | |
1 | 7.225 | 38.026 | 38.026 | 7.225 | 38.026 | 38.026 | 3.735 | 19.659 | 19.659 |
2 | 2.048 | 10.779 | 48.804 | 2.048 | 10.779 | 48.804 | 2.657 | 13.986 | 33.645 |
3 | 1.613 | 8.488 | 57.292 | 1.613 | 8.488 | 57.292 | 2.474 | 13.022 | 46.667 |
4 | 1.285 | 6.762 | 64.054 | 1.285 | 6.762 | 64.054 | 2.276 | 11.978 | 58.644 |
5 | 1.081 | 5.687 | 69.741 | 1.081 | 5.687 | 69.741 | 2.108 | 11.096 | 69.741 |
6 | .891 | 4.690 | 74.431 | ||||||
7 | .750 | 3.947 | 78.378 | ||||||
8 | .633 | 3.334 | 81.712 | ||||||
9 | .535 | 2.814 | 84.526 | ||||||
10 | .465 | 2.450 | 86.976 | ||||||
11 | .461 | 2.428 | 89.403 | ||||||
12 | .404 | 2.127 | 91.531 | ||||||
13 | .387 | 2.035 | 93.565 | ||||||
14 | .271 | 1.429 | 94.994 |
.258 | 1.355 | 96.350 | |
16 | .237 | 1.248 | 97.598 |
17 | .209 | 1.101 | 98.699 |
18 | .151 | .796 | 99.495 |
19 | .096 | .505 | 100.000 |
Extraction Method: Principal Component Analysis.
Ma trận xoay nhân tố
Component | |||||
1 | 2 | 3 | 4 | 5 | |
GC2 | .806 | ||||
GC3 | .759 | ||||
TD2 | .739 | ||||
TD3 | .733 | ||||
TD1 | .720 | ||||
GC1 | .649 | ||||
NTHI4 | .872 | ||||
NTHI3 | .834 | ||||
NTHI2 | .637 | ||||
NTHI1 | .576 | ||||
DSD3 | .741 | ||||
DSD2 | .732 | ||||
DSD1 | .652 | ||||
CNCL2 | .803 | ||||
CNCL3 | .770 | ||||
CNCL1 | .738 | ||||
CNTT2 | .891 | ||||
CNTT3 | .708 | ||||
CNTT1 | .688 |
Extraction Method: Principal Component Analysis. Rotation Method: Varimax with Kaiser Normalization.
a. Rotation converged in 6 iterations.
Phân tích nhân tố biến phụ thuộc
KMO and Bartlett's Test
.717 | |
Approx. Chi-Square | 161.250 |
Bartlett's Test of Sphericity df | 6 |
Sig. | .000 |
Kết quả phân tích nhân tố biến phụ thuộc
Initial | Eigenvalues | Extraction Sums of Squared Loadings | ||||
Total | % of Variance | Cumulative % | Total | % of Variance | Cumulative % | |
1 | 2.555 | 63.879 | 63.879 | 2.555 | 63.879 | 63.879 |
2 | .679 | 16.980 | 80.858 | |||
3 | .484 | 12.107 | 92.966 | |||
4 | .281 | 7.034 | 100.000 |
Extraction Method: Principal Component Analysis.
4. Kiểm định độ tin cậy của thang đo sau phân tích nhân tố EFA
Component Matrixa
Component | |
1 | |
YD3 | .860 |
YD2 | .824 |
YD1 | .784 |
YD4 | .723 |
Extraction Method: Principal Component Analysis.
a. 1 components extracted.
Reliability Statistics
N of Items | |
.882 | 6 |
Item-Total Statistics
Scale Mean if Item Deleted | Scale Variance if Item Deleted | Corrected Item- Total Correlation | Cronbach's Alpha if Item Deleted | |
TD1 | 19.91 | 7.326 | .606 | .875 |
TD2 | 19.88 | 6.915 | .719 | .857 |
TD3 | 20.09 | 6.536 | .767 | .849 |
GC1 | 19.66 | 6.980 | .677 | .864 |
GC2 | 20.06 | 6.531 | .764 | .849 |
GC3 | 19.53 | 7.707 | .632 | .872 |
5. Ma trận hệ số tương quan
Correlations
YD | DSD | NTHI | GCTD | CNTT | CNCL | ||
YD | 1.000 | .669 | .585 | .473 | .650 | .586 | |
DSD | .669 | 1.000 | .511 | .562 | .457 | .532 | |
Pearson Correlation | NTHI GCTD | .585 .473 | .511 .562 | 1.000 .445 | .445 1.000 | .444 .313 | .330 .469 |
CNTT | .650 | .457 | .444 | .313 | 1.000 | .309 | |
CNCL | .586 | .532 | .330 | .469 | .309 | 1.000 | |
YD | . | .000 | .000 | .000 | .000 | .000 | |
DSD | .000 | . | .000 | .000 | .000 | .000 | |
Sig. (1-tailed) | NTHI GCTD | .000 .000 | .000 .000 | . .000 | .000 . | .000 .000 | .000 .000 |
CNTT | .000 | .000 | .000 | .000 | . | .000 | |
CNCL | .000 | .000 | .000 | .000 | .000 | . | |
YD | 115 | 115 | 115 | 115 | 115 | 115 | |
DSD | 115 | 115 | 115 | 115 | 115 | 115 | |
N | NTHI GCTD | 115 115 | 115 115 | 115 115 | 115 115 | 115 115 | 115 115 |
CNTT | 115 | 115 | 115 | 115 | 115 | 115 | |
CNCL | 115 | 115 | 115 | 115 | 115 | 115 |
Variables Entered/Removeda
Variables Entered | Variables Removed | Method | |
1 | CNCL, CNTT, NTHI, GCTD, DSDb | . | Enter |
a. Dependent Variable: YD
b. All requested variables entered.
6. Hồi quy tuyến tính
Model Summaryb
R | R Square | Adjusted R Square | Std. Error of the Estimate | Change Statistics | Durbin-Watson | |||||
R Square Change | F Change | df1 | df2 | Sig. F Change | ||||||
1 | .827a | .683 | .669 | .33000 | .683 | 47.017 | 5 | 109 | .000 | 1.730 |
a. Predictors: (Constant), CNCL, CNTT, NTHI, GCTD, DSD
b. Dependent Variable: YD
ANOVAa
Sum of Squares | df | Mean Square | F | Sig. | ||
Regression | 25.601 | 5 | 5.120 | 47.017 | .000b | |
1 | Residual | 11.870 | 109 | .109 | ||
Total | 37.471 | 114 |
a. Dependent Variable: YD
b. Predictors: (Constant), CNCL, CNTT, NTHI, GCTD, DSD
Model | Unstandardized Coefficients | Standardized Coefficients | t | Sig. | Correlations | Collinearity Statistics | |||||
B | Std. Error | Beta | Zero- order | Partial | Part | Tolerance | VIF | ||||
(Constant) | -.533 | .321 | - 1.658 | .100 | |||||||
DSD | .247 | .073 | .256 | 3.364 | .001 | .669 | .307 | .181 | .502 | 1.991 | |
1 | NTHI | .238 | .077 | .207 | 3.101 | .002 | .585 | .285 | .167 | .653 | 1.531 |
GCTD | .002 | .075 | .002 | .033 | .974 | .473 | -.003 | -.002 | .616 | 1.625 | |
CNTT | .418 | .074 | .358 | 5.659 | .000 | .650 | .477 | .305 | .728 | 1.374 | |
CNCL | .265 | .064 | .272 | 4.139 | .000 | .586 | .369 | .223 | .671 | 1.490 | |
Hồi quy đa biến Coefficientsa
a. Dependent Variable: YD
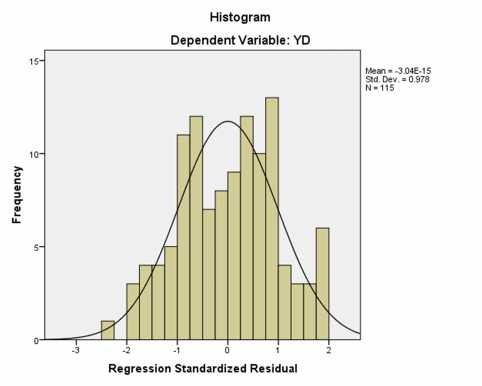
Biểu đồ tần số của phần dư chuẩn hóa
Mức độ ảnh hưởng của các nhân tố
Statistics
DSD1 | DSD2 | DSD3 | DSD | ||
N | Valid Missing | 115 0 | 115 0 | 115 0 | 115 0 |
Mean | 4.04 | 3.83 | 3.78 | 3.8870 | |
Median | 4.00 | 4.00 | 4.00 | 4.0000 |
DSD1
Frequency | Percent | Valid Percent | Cumulative Percent | ||
khong dong y | 2 | 1.7 | 1.7 | 1.7 | |
trung lap | 17 | 14.8 | 14.8 | 16.5 | |
Valid | dong y | 70 | 60.9 | 60.9 | 77.4 |
rat dong y | 26 | 22.6 | 22.6 | 100.0 | |
Total | 115 | 100.0 | 100.0 |
DSD2
Frequency | Percent | Valid Percent | Cumulative Percent | ||
khong dong y | 2 | 1.7 | 1.7 | 1.7 | |
trung lap | 34 | 29.6 | 29.6 | 31.3 | |
Valid | dong y | 60 | 52.2 | 52.2 | 83.5 |
rat dong y | 19 | 16.5 | 16.5 | 100.0 | |
Total | 115 | 100.0 | 100.0 |
DSD3
Frequency | Percent | Valid Percent | Cumulative Percent | ||
khong dong y | 3 | 2.6 | 2.6 | 2.6 | |
trung lap | 34 | 29.6 | 29.6 | 32.2 | |
Valid | dong y | 63 | 54.8 | 54.8 | 87.0 |
rat dong y | 15 | 13.0 | 13.0 | 100.0 | |
Total | 115 | 100.0 | 100.0 |
Statistics
NTHI1 | NTHI2 | NTHI3 | NTHI4 | NTHI | ||
N | Valid Missing | 115 0 | 115 0 | 115 0 | 115 0 | 115 0 |
Mean | 3.94 | 3.57 | 3.91 | 3.77 | 3.7978 | |
Median | 4.00 | 4.00 | 4.00 | 4.00 | 4.0000 |
NTHI1
Frequency | Percent | Valid Percent | Cumulative Percent | ||
khong dong y | 1 | .9 | .9 | .9 | |
trung lap | 17 | 14.8 | 14.8 | 15.7 | |
Valid | dong y | 85 | 73.9 | 73.9 | 89.6 |
rat dong y | 12 | 10.4 | 10.4 | 100.0 | |
Total | 115 | 100.0 | 100.0 |
NTHI2
Frequency | Percent | Valid Percent | Cumulative Percent | ||
khong dong y | 10 | 8.7 | 8.7 | 8.7 | |
trung lap | 38 | 33.0 | 33.0 | 41.7 | |
Valid | dong y | 59 | 51.3 | 51.3 | 93.0 |
rat dong y | 8 | 7.0 | 7.0 | 100.0 | |
Total | 115 | 100.0 | 100.0 |
NTHI3
Frequency | Percent | Valid Percent | Cumulative Percent | ||
trung lap | 28 | 24.3 | 24.3 | 24.3 | |
Valid | dong y rat dong y | 69 18 | 60.0 15.7 | 60.0 15.7 | 84.3 100.0 |
Total | 115 | 100.0 | 100.0 |